


Excluding Housing Costs, U.S. Inflation Is Well Below 2%
KEY TAKEAWAYS
- Inflation has been running notably below the Federal Reserve’s 2% target if the cost of housing services, or shelter, is excluded.
- Shelter costs have contributed to inflation to a much greater degree in recent years. This could be a worrying signal about weak underlying inflation trends.
- Shelter costs may contain transitory factors not reflecting broader inflationary pressures. If shelter inflation returns to its historic average, overall inflation may undershoot 2%.

Is inflation near the Fed’s target of 2%? Has the average inflation rate been stable during the last five, 10 and 25 years?
Two well-known inflation measures that can be used to answer these questions—the headline (all items) and core (excluding food and energy) consumer price indexes—answer both questions in the affirmative. (See Table 1.) Inflation appears to be very close to the Fed’s target now and has exhibited remarkable stability during the last quarter century.The personal consumption expenditures (PCE) chain price index computed by the Bureau of Economic Analysis and the PCE price index excluding food and energy (core PCE) are used by the Federal Reserve in communicating its inflation objectives. Depending on the time period considered in Table 1, the PCE and core PCE measures of inflation were 0.2 to 0.6 percentage points lower than their CPI counterparts. I discuss the CPI in this article because details are available for more components and special aggregates, such as all items less shelter. For more information on the differences between CPI and PCE inflation, see Bullard.
| 1 Year | 5 Years | 10 Years | 25 Years | 50 Years | |
|---|---|---|---|---|---|
| CPI-U: All Items | 2.0% | 1.7% | 1.7% | 2.2% | 3.9% |
| CPI-U: All Items Less Food and Energy | 2.3% | 2.1% | 1.9% | 2.1% | 3.9% |
| CPI-U: All Items Less Shelter | 1.4% | 0.9% | 1.3% | 1.9% | 3.7% |
| CPI-U: Shelter | 3.3% | 3.3% | 2.6% | 2.8% | 4.6% |
SOURCES: Bureau of Labor Statistics and author’s calculations.
NOTES: CPI-U is the consumer price index for all urban consumers. The all-items index is headline or overall inflation. Core inflation is the index of all items less food and energy. All periods end in the fourth quarter of 2019.
An alternative inflation measure, which excludes only the cost of housing services (shelter), gives a very different answer. Consumer price inflation excluding shelter was only 1.4% in the year through the fourth quarter of 2019. This measure increased at only a 0.9% annualized rate during the last five years and at just a 1.3% rate during the last 10 years. In other words, consumer prices for all items except shelter are rising at a pace notably below 2%. (See the last two rows of Table 1.)
Should the Fed worry that inflation excluding housing costs has been running considerably below 2% for many years? To decide how to evaluate the conflicting signals, one must consider what stripping out food and energy costs, on the one hand, and shelter costs, on the other, reveals.
I will argue that low inflation excluding shelter costs is a worrying signal about weak underlying inflation trends. This is because shelter costs have accounted for an unusually large share of measured inflation recently—pushing up overall inflation by about 0.8 percentage points during the last five years. If the contribution of shelter to overall inflation reverts to its longer-term norm (adding about 0.2 percentage points to the overall index), all broad measures of inflation—including headline and core—are likely to undershoot 2%. In other words, except for the unusually large and possibly transitory contribution of housing costs, consumer prices are rising much less than 2%.
Why Stripping Out Food and Energy Costs Makes Sense
The prices of some items in the typical consumer’s basket of purchases, like food and energy, can be volatile in the short run, but their paths do not deviate much from those of all other items in the long run. Table 1 shows that, at 10-, 25- and even 50-year horizons, headline and core inflation measures are almost identical.
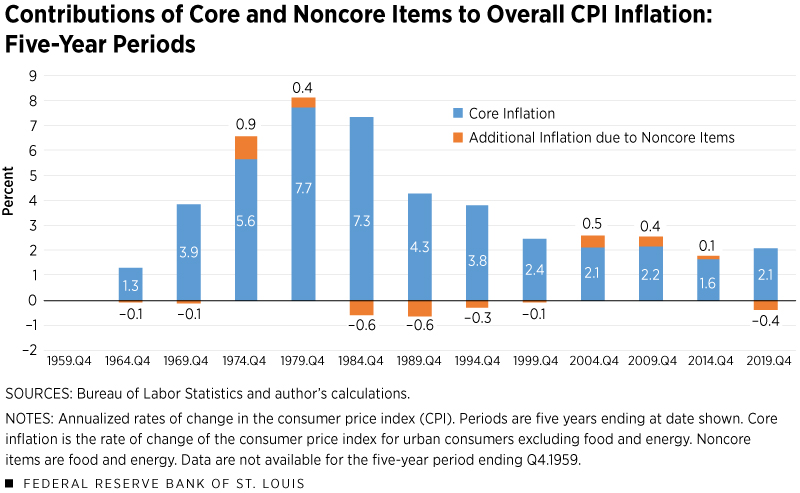
Yet at one- and even five-year horizons, food and energy price changes can be much greater than for most other items.Core CPI is less volatile than the all-items CPI. The standard deviations of quarterly percent changes in the all-items and core CPI measures for the period 1957:Q4 through 2019:Q4 were 3.1% and 2.7%, respectively. For major components of the CPI, standard deviations were 4.0% for food, 15.2% for energy, 3.7% for shelter, 3.0% for medical care services, 3.7% for transportation services, 3.0% for apparel, 3.8% for new vehicles, and 10.8% for used cars and trucks. Because the headline and core measures converge in the long run, we can reasonably interpret the short-run volatility of food and energy prices as transitory “noise” that tends to cancel itself out over time. Therefore, many economists believe it makes sense to exclude them when gauging “underlying” inflation pressures at a point in time. In other words, core inflation might be a reasonable short- to medium-term proxy for the underlying trend of inflation because it eliminates undue influence from volatile food and energy prices.
To be sure, inflation due to noncore items matters to consumers over all horizons. But economists are particularly interested in measures that may reveal inflation trends, since inflation and inflation expectations appear to be “sticky.” (See Figure 1.)
Why Stripping Out Shelter Costs Makes Sense
Shelter is a large and growing part of the consumer basket of goods and services represented by the consumer price index (CPI).The weight of shelter in the PCE index is considerably less than in the CPI. See Bednar and Knotek. (See Table 2.)
| 1994:Q4 | 2009:Q4 | 2014:Q4 | 2019:Q4 | |
|---|---|---|---|---|
| CPI-U: All Items | 100% | 100% | 100% | 100% |
| CPI-U: All Items Less Food and Energy | 77.3% | 77.3% | 77.4% | 79.3% |
| CPI-U: All Items Less Shelter | 71.9% | 67.6% | 67.5% | 66.5% |
| CPI-U: Shelter | 28.1% | 32.4% | 32.5% | 33.5% |
| Shelter Components: | ||||
| Rent of Primary Residence | — | 5.9% | 7.1% | 8.0% |
| Owners' Equivalent Rent of Residences | — | 24.4% | 24.2% | 24.2% |
| Other Shelter Items | — | 2.2% | 1.2% | 1.3% |
SOURCES: Bureau of Labor Statistics and author’s calculations.
NOTES: CPI-U is the consumer price index for all urban consumers. The figures in the table report the share of the all-items consumer price index accounted for by the components included in each index. For example, the shelter component accounted for 33.5% of the all-items CPI in the fourth quarter of 2019. Other shelter items include lodging away from home, and tenants’ and household insurance. Shelter component data for 1994 were not available. Totals may not add up due to rounding.
Compared to food and energy inflation, shelter inflation doesn't vary a great deal from quarter to quarter. Also, unlike for food and energy, inflation measures including and excluding shelter do not converge to within 0.1 percentage point of each other in the long run, as Table 1 shows. Thus, for at least three reasons—its large contribution to the index, its relatively low quarter-to-quarter volatility, and its tendency to increase more in the long run than the components that make up the rest of the index—one might hesitate to strip out shelter to compute a measure of underlying inflation.
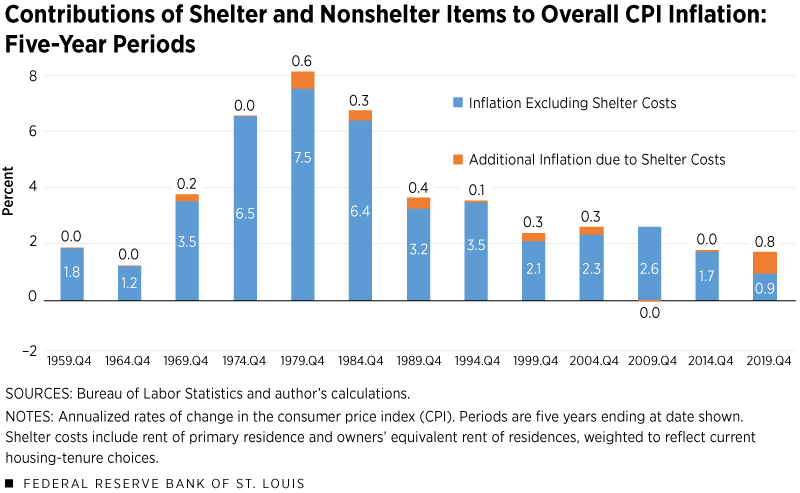
Figure 2 shows that shelter costs generally raise the overall level of inflation. In the most recent five-year period, rising shelter costs contributed an unusually large amount to headline inflation.
One important characteristic of shelter costs argues in favor of studying a nonshelter inflation index, however. Year-to-year movements of shelter costs are less synchronized with the remaining components of the CPI than is the case for food and energy. For example, the correlation coefficient measuring the comovement of annual shelter-cost changes with CPI less shelter changes was –0.11 for the 25-year period ending in the fourth quarter of 2019, while the corresponding figures for food and energy with their respective indexes excluding those costs were 0.15 and 0.10, respectively.A correlation coefficient measures the degree to which two variables move together. A coefficient of 1.00 reflects perfectly synchronized movements; –1.00 reflects perfect synchronization but in opposite directions; and a coefficient of zero reflects completely unrelated movements. Differences between shelter comovements with the index excluding shelter and corresponding correlation measures for food and energy were slightly larger during the most recent 15 year period, at –0.12, 0.16 and 0.20, respectively. This suggests there may be factors unique to housing that do not reflect price pressures on other goods or services. Thus, stripping them out may provide a more accurate picture of the broad-based inflation trend.
Rising Construction Costs May Not Reflect Overall Inflation Pressures
In recent years, the large contribution of shelter costs to headline CPI inflation may reflect fast-rising real-estate construction costs and new-home prices rather than broader inflationary pressures (e.g., higher prices of durable and nondurable goods or services other than housing).See Emmons, September 2019. Movements in prices for new and existing homes generally are closely connected. Moreover, the cost of rented housing and the rental-equivalence measure used for owner-occupied housing in inflation indexes, in turn, follow local house-price trends.The rental-equivalence measure of inflation contributed by owner-occupied housing is the owners’ equivalent rent of residences. See also Emmons, 2016.
Cost pressures in the real-estate construction sector reflect lingering effects of the housing crash. Many workers left the construction sector when work dried up after 2008; for these and other reasons, productivity growth actually has been negative in residential construction, driving up costs.See Cilia.
The rise in shelter costs may eventually be dampened by slowing consumer demand for housing services.See Emmons, June 2019. Supply-side improvements, such as construction robotics, also could slow the rise in housing-construction and shelter costs.
In any case, unique challenges in residential construction and housing markets mean it makes sense to look at inflation excluding shelter costs. The important implication is that the very low rates of nonshelter inflation in recent years reveal underlying inflation pressures that are weaker than more commonly used measures would suggest.
Endnotes
- The personal consumption expenditures (PCE) chain price index computed by the Bureau of Economic Analysis and the PCE price index excluding food and energy (core PCE) are used by the Federal Reserve in communicating its inflation objectives. Depending on the time period considered in Table 1, the PCE and core PCE measures of inflation were 0.2 to 0.6 percentage points lower than their CPI counterparts. I discuss the CPI in this article because details are available for more components and special aggregates, such as all items less shelter. For more information on the differences between CPI and PCE inflation, see Bullard.
- Core CPI is less volatile than the all-items CPI. The standard deviations of quarterly percent changes in the all-items and core CPI measures for the period 1957:Q4 through 2019:Q4 were 3.1% and 2.7%, respectively. For major components of the CPI, standard deviations were 4.0% for food, 15.2% for energy, 3.7% for shelter, 3.0% for medical care services, 3.7% for transportation services, 3.0% for apparel, 3.8% for new vehicles, and 10.8% for used cars and trucks.
- The weight of shelter in the PCE index is considerably less than in the CPI. See Bednar and Knotek.
- A correlation coefficient measures the degree to which two variables move together. A coefficient of 1.00 reflects perfectly synchronized movements; –1.00 reflects perfect synchronization but in opposite directions; and a coefficient of zero reflects completely unrelated movements. Differences between shelter comovements with the index excluding shelter and corresponding correlation measures for food and energy were slightly larger during the most recent 15-year period, at –0.12, 0.16 and 0.20, respectively.
- See Emmons, September 2019.
- The rental-equivalence measure of inflation contributed by owner-occupied housing is the owners’ equivalent rent of residences. See also Emmons, 2016.
- See Cilia.
- See Emmons, June 2019.
References

Views expressed in Regional Economist are not necessarily those of the St. Louis Fed or Federal Reserve System.
For the latest insights from our economists and other St. Louis Fed experts, visit On the Economy and subscribe.
Email Us