


President's Message: CPI vs. PCE Inflation: Choosing a Standard Measure
Two different price indexes are popular for measuring inflation: the consumer price index (CPI) from the Bureau of Labor Statistics and the personal consumption expenditures price index (PCE) from the Bureau of Economic Analysis. Each of these is constructed for different groups of goods and services, most notably a headline (or overall) measure and a core (which excludes food and energy prices) measure. Which one gives us the actual rate of inflation that consumers face?
On the headline vs. core issue, I prefer to focus on headline inflation, measured as the percentage change in the price index from a year ago to smooth out the fluctuations in the data. As I have discussed previously, headline measures attempt to reflect the prices that households pay for a wide variety of goods, not a subset of those goods.[1] Headline inflation is, therefore, designed to be the best measure of inflation that we have.
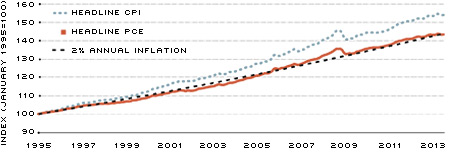
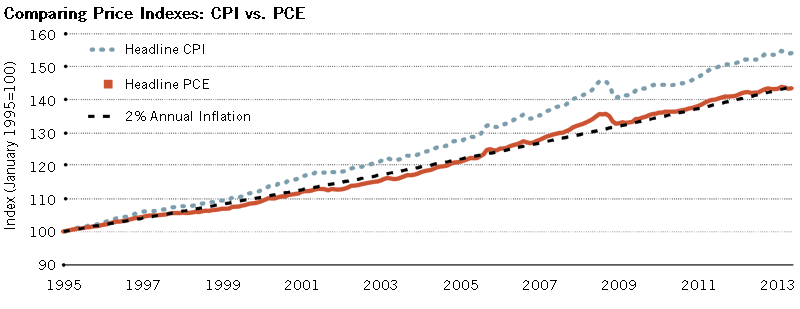
Between the two headline indexes, the CPI tends to show more inflation than the PCE. From January 1995 to May 2013, the average rate of inflation was 2.4 percent when measured by headline CPI and 2.0 percent when measured by headline PCE. Hence, after setting both indexes equal to 100 in 1995, the CPI was more than 7 percent higher than the PCE in May 2013.[2] (See the chart.)
An accurate measure of inflation is important for both the U.S. federal government and the Federal Reserve's Federal Open Market Committee (FOMC), but they focus on different measures. For example, the federal government uses the CPI to make inflation adjustments to certain kinds of benefits, such as Social Security.[3] In contrast, the FOMC focuses on PCE inflation in its quarterly economic projections and also states its longer-run inflation goal in terms of headline PCE. The FOMC focused on CPI inflation prior to 2000 but, after extensive analysis, changed to PCE inflation for three main reasons: The expenditure weights in the PCE can change as people substitute away from some goods and services toward others, the PCE includes more comprehensive coverage of goods and services, and historical PCE data can be revised (more than for seasonal factors only).[4]
Given that the two indexes show different inflation trends in the longer run, having a single preferred measure that is used by both the federal government and the FOMC might be appropriate. What would it mean if it were determined that headline PCE inflation is the better measure of prices consumers face (indicating, thus, that the CPI overstates the true inflation rate)? Continuing to use the CPI would imply over-adjusting for inflation and, in effect, giving real increases in benefits over time. In this scenario, benefits should be adjusted for inflation using the PCE instead. Conversely, if it were determined that headline CPI inflation is the better measure (and, therefore, that the PCE understates the true inflation rate), then the FOMC should target CPI inflation rather than PCE inflation.
The FOMC carefully considered both indexes when evaluating which metric to target and concluded that PCE inflation is the better measure. In my view, headline PCE should become the standard and, therefore, should be consistently used to estimate and adjust for inflation. Although adopting a standard measure would likely not be a simple matter, it would provide clarity to the public about which one more accurately reflects consumer price inflation.
Comparing Price Indexes: CPI vs. PCE
SOURCES: Data obtained from FRED® (Federal Reserve Economic Data) and author's calculations.
FRED is a registered trademark of the Federal Reserve Bank of St. Louis.
Endnotes
- See "Measuring Inflation: The Core Is Rotten," Federal Reserve Bank of St. Louis Review, July/August 2011, Vol. 93, No. 4, pp. 223-33. See http://research.stlouisfed.org/publications/review/11/07/bullard.pdf. [back to text]
- In 2002, the Bureau of Labor Statistics began releasing a chain-weighted version of the CPI, which behaves similarly to the PCE over long periods of time. [back to text]
- CPI-W, the index for urban wage earners and clerical workers, is used to adjust these benefits for inflation, whereas CPI-U (headline) is shown in the chart. The two show similar trends from 1995 to the present. [back to text]
- For more discussion, see the Monetary Policy Report to the Congress, on Feb. 17, 2000, at www.federalreserve.gov/boarddocs/hh/2000/February/FullReport.pdf. [back to text]

Views expressed in Regional Economist are not necessarily those of the St. Louis Fed or Federal Reserve System.
For the latest insights from our economists and other St. Louis Fed experts, visit On the Economy and subscribe.
Email Us