


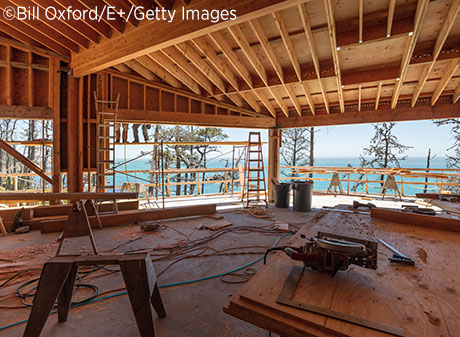
Construction Costs, Not Another Housing Bubble, Are Driving House Prices Higher
KEY TAKEAWAYS
- Three national house price indexes stood more than 50% above their 2012 troughs in the first quarter of 2019.
- Unlike the housing bubble period before the Great Recession, recent mortgage borrowing and expectations for house price gains have been subdued.
- Construction costs could be a larger factor in house price trends than either credit conditions or house price expectations.
National house price indexes have rebounded significantly from their 2012 troughs, outstripping both per capita personal income and inflation. (See Figure 1.) As of the first quarter of 2019, three broad house price indexes—FHFA’s expanded-data House Price Index, the S&P CoreLogic Case-Shiller Home Price Index and the CoreLogic National House Price Index—all stood more than 50% above levels from seven years earlier, corresponding to an average annual rate of increase of about 6%. Meanwhile, per capita personal income increased about 25% in those seven years (3.3% annually), while consumer prices were up only about 12% (1.5% annually).
House Price Gains Have Outpaced Growth in Incomes and Inflation Since 2012
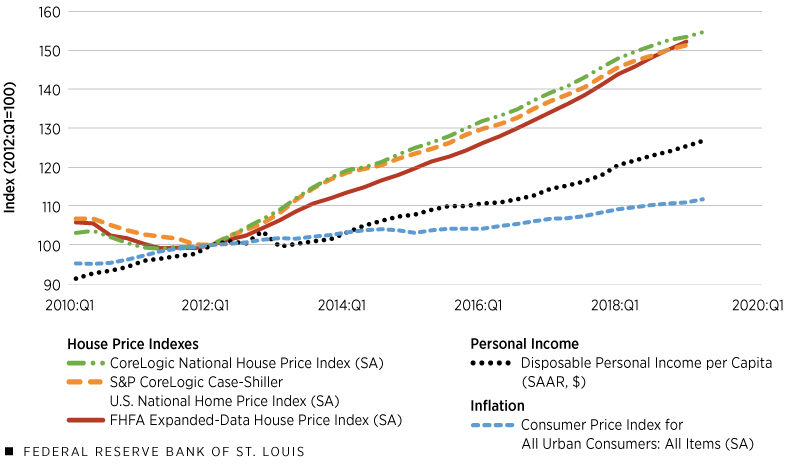
SOURCES: Federal Housing Finance Agency, Standard and Poor’s, CoreLogic, Bureau of Economic Analysis and Bureau of Labor Statistics.
NOTES: SA denotes seasonally adjusted. SAAR denotes seasonally adjusted annual rate.
DESCRIPTION: The chart shows three national home price indexes outpacing gains in disposable income and inflation for the period 2010-19. All observations have index values of 100 in the first quarter of 2012, when the housing indexes hit their troughs and started their ascents. The observation period ends in the first quarter of 2019 for the FHFA and S&P CoreLogic home price indexes and in the second quarter of 2019 for all other series.
Why have house prices risen so much faster than personal incomes or inflation? Is another housing bubble brewing? The answers to these questions may lie less in “irrational exuberance” than in the costs of land, lumber and labor.
Understanding the Housing Bubble
Some economists believe the housing bubble whose bursting led to the Great Recession was inflated by sharp increases in the availability and use of mortgage credit, especially by high-risk borrowers.See Mian, Atif and Sufi, Amir. House of Debt, 2014. Others suggest widespread expectations of rapid house price growth held by people across the income spectrum became a self-fulfilling prophecy.See Kaplan, Greg; Mitman, Kurt; and Violante, Giovanni L. “The Housing Boom and Bust: Model Meets Evidence,” NBER Working Paper No. 23694, August 2017. Another possibility is that the cost of new-home construction increased rapidly, particularly in supply-constrained markets on both coasts, driving up prices of new homes. Because markets for new and existing homes are closely linked, new-home cost pressures might have affected broad house price indexes.The correlation between annual changes in the national median sales price of an existing home and that of a constant-quality new home was 0.88 for the period 1968-2018, according to data from the National Association of Realtors and the Census Bureau. A co-efficient of 1.00 represents perfect correlation.
Rapidly Rising Prices: Another Housing Bubble in the Making?
Which, if any, of the possible causes of a housing bubble are present today?
Rapid growth of mortgage lending
In contrast to the period of rapidly rising prices during the pre-recession housing bubble, recent growth in mortgage debt has been subdued.See Emmons, William R.; Kent, Ana H.; and Ricketts, Lowell R. “‘Debtless’ Housing Boom Leads Household Wealth Recovery,” St. Louis Fed On the Economy Blog, February 18, 2019. Per capita home mortgage debt increased only about 1.6% in the seven years ending in the first quarter of 2019.See the Federal Reserve’s Financial Accounts of the United States – Z.1 Release, and the Census Bureau for population figures. This is just 0.2% annually, a far slower pace than the rate of growth in income or house prices. Thus, it does not appear that aggressive mortgage borrowing is driving up house prices.
Expectations of rapid house price gains
Survey measures of expectations for home price appreciation, which pointed to irrational exuberance among buyers and sellers in the 2000s, have shown no signs of similar broad-based expectations in recent years.See Case, Karl E.; Shiller, Robert J.; and Thompson, Anne. “What Have They Been Thinking? Homebuyer Behavior in Hot and Cold Markets—A 2014 Update,” Cowles Foundation Discussion Paper No. 1876R, March 2014; or the Zillow Home Price Expectations Survey. Thus, it’s difficult to pin recent strength in house prices nationwide on “bubbly” expectations.
Rising construction costs
Construction costs have received less attention than mortgage lending and unrealistic house price expectations, but they appear to be an important part of the recent run-up in house prices.
The Surprisingly Important Role of Construction Costs
In the long run, one would expect construction costs—including the cost of land acquisition and improvement, and of the structures built upon it—to be the primary determinant of new-home prices if local markets for new housing are competitive. Local supply-side distortions like restrictive zoning regulations may inflate prices in some areas for a while, but competition posed by other housing markets are likely to limit those aberrations.
In fact, aggregate data for the U.S. suggest the national housing market (i.e., the sum of all local housing markets) is not far from the competitive ideal. Since 1963, when data first became available for sales of new single-family homes that are comparable over time in terms of quality (including size and amenities), this measure of house prices and the cost of residential construction have increased in virtual lockstep (Figure 2)—by 0.98% and 0.91% annually, after adjusting for inflation.
Real New-Home Prices and Construction Costs Have Moved in Tandem for Decades
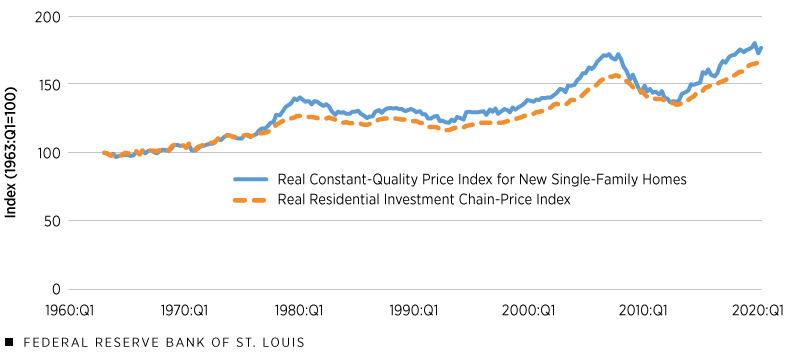
SOURCES: Census Bureau and Bureau of Economic Analysis.
DESCRIPTION: The chart shows the real, or inflation-adjusted, price index for constant-quality new single-family homes sold moving in near lockstep with construction costs, measured by the real residential investment chain-price index, for the period 1963-2019. Both series are indexed to 100 in the first quarter of 1963. The last observation is for the second quarter of 2019.
The Recent Period Is No Exception: Construction Costs Drive House Prices Higher
The relationship between construction costs and selling prices of constant-quality new homes turns out to be quite strong even in the short run. (See Figure 3.) Measured from the first quarter of 2012, constant-quality new-home prices have increased 29% (through the second quarter of 2019), while the cost of residential construction has increased by 23%.
Nearer Term, the Link between Real New-Home Prices and Construction Costs Has Stayed Strong
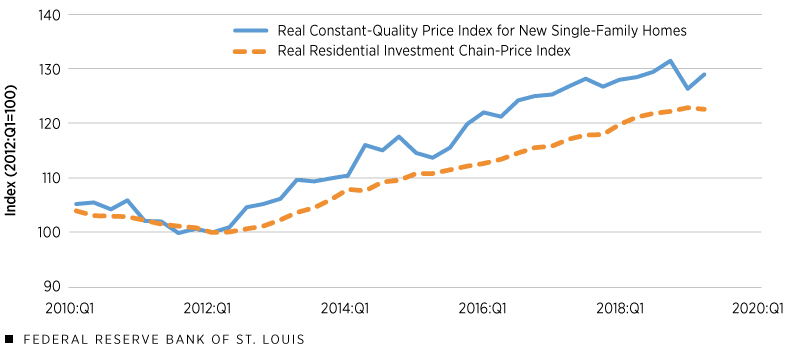
SOURCES: Census Bureau and Bureau of Economic Analysis.
DESCRIPTION: The chart shows the real, or inflation-adjusted, price index for constant-quality new single-family homes sold moving in tandem with construction costs, measured by the real residential investment chain-price index, for the shorter period of 2010-2019. Both series are indexed to 100 in the first quarter of 2012. The last observation is for the second quarter of 2019.
Looking at the period since 2000, construction costs appear to be much more closely linked to constant-quality home prices than is the growth of mortgage debt throughout the whole period. (See Figure 4.) Expectations of future house price gains also are moderate, in contrast to relatively rapid house price gains.
New-Home Prices Have Been More Closely Aligned with Construction Costs than with Mortgage Debt
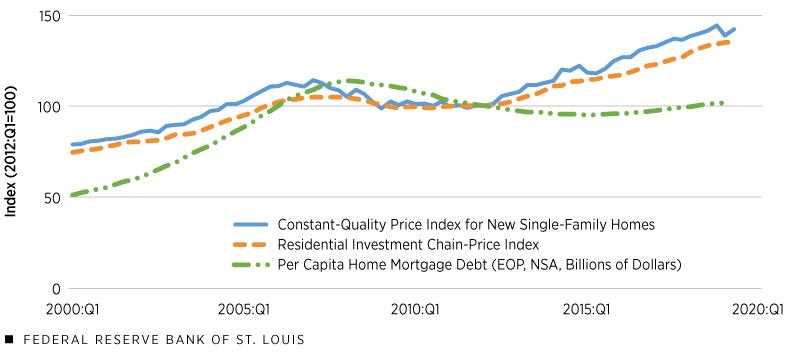
SOURCES: Census Bureau, Bureau of Economic Analysis and Federal Reserve System.
NOTES: EOP denotes end of period. NSA denotes not seasonally adjusted.
DESCRIPTION: The chart shows the price index for constant-quality new single-family homes moving in tandem with construction costs, measured by the residential investment chain-price index, for the period 2000-19. A third index, tracking per capita mortgage debt outstanding, falls below and away from the two other indexes. All series are indexed to 100 in the first quarter of 2012. The observation period ends in the first quarter of 2019 for mortgage debt and in the second quarter of 2019 for the two other series.
Thus, construction costs could be a much more important determinant of house price trends than either credit conditions or house price expectations. Seen in this light, the common characterization that sharply rising house prices portend a housing bubble—that is, an outbreak of irrational exuberance of one kind or another—is not entirely convincing.
Endnotes
- See Mian, Atif and Sufi, Amir. House of Debt, 2014.
- See Kaplan, Greg; Mitman, Kurt; and Violante, Giovanni L. “The Housing Boom and Bust: Model Meets Evidence,” NBER Working Paper No. 23694, January 2019.
- The correlation between annual changes in the national median sales price of an existing home and that of a constant-quality new home was 0.88 for the period 1968-2018, according to data from the National Association of Realtors and the Census Bureau. A co-efficient of 1.00 represents perfect correlation.
- See Emmons, William R.; Kent, Ana H.; and Ricketts, Lowell R. “‘Debtless’ Housing Boom Leads Household Wealth Recovery,” St. Louis Fed On the Economy Blog, February 18, 2019.
- See the Federal Reserve’s Financial Accounts of the United States – Z.1 Release, and the Census Bureau for population figures.
- See Case, Karl E.; Shiller, Robert J.; and Thompson, Anne. “What Have They Been Thinking? Homebuyer Behavior in Hot and Cold Markets—A 2014 Update,” Cowles Foundation Discussion Paper No. 1876R, March 2014; or the Zillow Home Price Expectations Survey.
This article originally appeared in our Housing Market Perspectives publication.

Citation
William R. Emmons, ldquoConstruction Costs, Not Another Housing Bubble, Are Driving House Prices Higher,rdquo St. Louis Fed On the Economy, Sept. 5, 2019.
This blog offers commentary, analysis and data from our economists and experts. Views expressed are not necessarily those of the St. Louis Fed or Federal Reserve System.
Email Us
All other blog-related questions