


Slowing U.S. Housing Sector Still Shaped by Great Recession
KEY TAKEAWAYS
- The U.S. housing market has rebounded from the Great Recession, though the lingering effects of the downturn can still be seen.
- At the end of 2005, residential investment represented about 6.7 percent of U.S. GDP. At the end of 2018, this figure was only 3.8 percent of GDP.
- Declining affordability, higher mortgage rates, higher construction costs and declines in equity prices slowed the U.S. and District housing markets in 2018.
As the U.S. closes in on the 10th year of this economic expansion, unemployment is at its lowest rate since 1969, and in many ways, the Great Recession is now history. However, the U.S. housing market tells a different story, and the lingering effects of the Great Recession are still shaping this sector of the economy.
In this article, we will describe the trends in the housing market at the national level, and how these trends are different from the ones observed across the Eighth Federal Reserve District.Headquartered in St. Louis, the Eighth Federal Reserve District includes all of Arkansas and parts of Illinois, Indiana, Kentucky, Mississippi, Missouri and Tennessee.
U.S. gross domestic product (GDP) has been steadily increasing since the end of the Great Recession, and real GDP grew by about 3.0 percent in 2018. The U.S. housing market is reflective of this growth and, in several ways, seems to have rebounded from the Great Recession.
The U.S. median house price in 2018 was about $262,000; in real terms, this was about 43 percent higher than the bottom in 2011 but still 9 percent lower than the pre-recession peak. While a shortage of workers and building lots has hampered residential construction activity, residential building permits have grown 9.3 percent per year, and residential investment has averaged 3.2 percent growth per year in the recovery period from 2010 to 2018. Home sales, while still below the pre-recession peak, have rebounded with a strong overall growth of 51.2 percent.
However, despite these positive effects of the recovery process, some subsectors of the housing market seem to be lagging. According to the National Association of Home Builders (NAHB), the housing contribution to GDP generally averages 15 to 18 percent, and it occurs through two channels: residential investment (such as construction of new homes and residential remodeling) and consumption spending on housing services (such as gross rents and utilities paid by renters, and owners’ imputed rents and utility payments).See www.nahb.org/en/research/housing-economics/housings-economic-impact/housings-contribution-to-gross-domestic-product-gdp.aspx.
While consumption spending on housing services has remained relatively constant (averaging 12.4 percent of GDP between 2011 and 2018), residential investment tells a different story. At the peak of the housing bubble, toward the end of 2005, residential investment made up 6.7 percent of U.S. GDP; about a year after the recession ended, residential investment bottomed out at 2.4 percent of GDP. At the end of 2018, this share stood at only 3.8 percent of U.S. GDP, just slightly higher than its low point at the depths of the 1990 recession (3.4 percent).
It is also interesting to note that despite the rebound in home prices, households have not reverted to taking on more housing as assets in their portfolios. Residential real estate now accounts for up to 20 percent of household balance sheets, down from almost 30 percent before the Great Recession. Industry contacts point to factors such as higher student debt balances, tighter lending standards, lack of inventory of homes and slow wage growth as keeping potential buyers from the market.For more on the effect of student debt on mortgages, see www.federalreserve.gov/publications/files/consumer-community-context-201901.pdf. Consequently, single-family homes are less affordable than they were in the mid-1990s and early 2000s.Measured as median house price divided by median family income.
Recent Trends in the Housing Market
There are signs that 2018 may have marked the end of the strong run for the U.S. housing market during this recovery. Single-family home sales at the end of December 2018 were about 13 percent lower relative to the same period in 2017. House price growth has steadily decelerated since 2013, with the median sale price up by only about 1.5 percent in December 2018 relative to a year ago, as compared to 7.3 percent in the same period in 2017.
For the first time in this recovery period, housing prices increased at a slower rate than median family incomes in 2018. While incomes growing faster than prices may positively affect the market, housing continued to become less affordable, as higher mortgage rates increased monthly payments, and declines in equity prices reduced other household assets that could be used for a down payment.
Construction activity remained positive in 2018 but faces headwinds to further growth, most notably a shortage of workers. Higher labor costs combined with higher material costs have put the cost of building a new home above the selling price in some markets. A reflection of these headwinds can be seen in the NAHB’s Housing Market Index, which measures homebuilders’ optimism: The index declined steadily during 2018, although it remained elevated by historical averages as of January 2019.
Housing Markets in the Eighth District
While there are some structural issues that make the Eighth District housing market different from the national market, regional trends have generally been consistent with national trends. Structural differences that play an important role in determining housing prices include housing affordability, population growth and the elasticity of the supply of housing.
Several factors determine housing demand, such as mortgage rates, housing affordability and population growth. Mortgage debt growth follows similar trends to those of the nation,See Mather and Schlagenhauf. indicating that other demand factors have a greater role in determining housing demand in the Eighth District.
| Nominal Median House Price (MHP)* |
Change in Real MHP since 2005:Q4 Peak |
Average Nominal MHP Growth since 2011:Q4 |
Housing Opportunity Index (HOI) (In Percent) 2018:Q4 |
Percentage Point Change in HOI 2011:Q4-2018:Q4 |
|
|---|---|---|---|---|---|
| U.S. | $262,279 | -9.40% | 6.30% | 56.6 | -19.3 |
| Little Rock, Ark., MSA | $146,955 | -10.20% | 1.60% | — | — |
| Louisville, Ky., MSA | $182,412 | 3.80% | 4.50% | 75.4 | -6.6 |
| Memphis, Tenn., MSA | $177,763 | -6.30% | 6.60% | 70.4 | -12.2 |
| St. Louis MSA | $179,103 | -8.20% | 4.60% | 79.7 | -5.3 |
*In an earlier version of this article, the nominal median house price column used data from Redfin. This column has been updated with data from the National Association of Realtors.
NOTE: MHP values are from 2018:Q4.
SOURCES: National Association of Realtors, Haver Analytics and authors’ calculations.
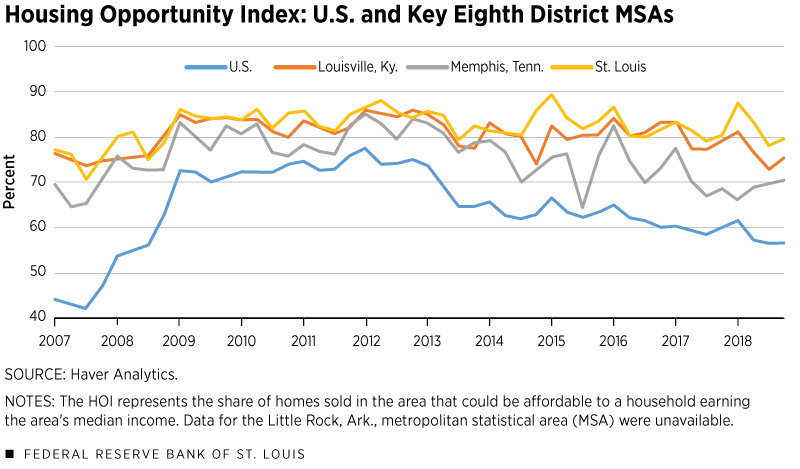
The NAHB’s Housing Opportunity Index shows that housing tends to be much more affordable in St. Louis, the District’s largest metropolitan statistical area (MSA). Nationally, the median household could afford 56.4 percent of homes sold in the third quarter of 2018.There are numerous assumptions in estimating the monthly payment on a home such as down payment amount and interest rate, and the basic premise is that a household can afford to pay 28 percent of its gross income on housing. For the median household in the St. Louis MSA, the number rises to 77.8 percent of homes sold. While greater affordability is indicative of higher demand, housing demand growth has steadily slowed over the past few years in the District, which is consistent with national trends (albeit at a slower rate).
In addition to housing affordability, the demand for housing can also be captured in population growth, which has increased more slowly in the District than in the nation. With fewer additional residents, fewer new homes or apartments are needed. However, we see that the effect of slower population growth is somewhat offset by other demand factors—such as lifestyle, location, affordability and relative rents—and this is reflected in higher homeownership rates in the District, relative to the nation.
Yet, economic research has typically found that supply-side factors are most important in explaining regional differences in housing prices. When demand increases and prices rise, homebuilders have an incentive to build more homes. Homebuilders’ actual ability to respond to these higher prices is called the elasticity of housing supply.
Economist Albert Saiz points out that these elasticities vary greatly across cities, as building requires new land, permits, materials and labor. Saiz estimates a housing supply elasticity of 1.75 across all MSAs, which implies that an increase in house prices by 1 percent results in an increase in the supply of homes of 1.75 percent. In the extreme case of Miami, this elasticity falls to 0.60 percent, and on the other end is Wichita, Kan., at 5.45 percent. St. Louis has a supply elasticity of 2.36 percent.
| Home Sales Growth 2011-2018 |
Homeownership Rate 2017 |
Single-Family Building Permit Growth 2011-2018 |
Population Growth 2011-2017 |
Housing Supply Elasticities | |
|---|---|---|---|---|---|
| U.S. | 51.2% | 63.9% | 110.1% | 4.3% | 1.75 |
| Little Rock, Ark., MSA | 61.8% | 61.0% | 9.1% | 4.0% | 2.34 |
| Louisville, Ky., MSA | — | 71.7% | 80.2% | 4.0% | 2.79 |
| Memphis, Tenn., MSA | 65.2% | 62.4% | 62.0% | 1.2% | 1.76 |
| St. Louis MSA | 65.2% | 65.6% | 62.5% | 0.5% | 2.36 |
SOURCES: Zillow, Saiz (2010), Haver Analytics and authors’ calculations.
NOTES: Home sales data are from Zillow and are from January 2011 to November2018. Due to data limitations, we do not have sales data for Louisville. U.S. value for the housing supply elasticities is a weighted average of all metropolitan statistical areas.
Thus, it is clear that even though St. Louis has a relatively high elasticity of housing supply, it is experiencing a slower growth in home prices because demand factors, such as limited population growth and a declining homeownership rate, are exerting a downward pressure on prices.
Conclusion
Despite significant headwinds from changing household preferences, increasing student debt, tighter lending standards, and shortages of labor and lots, the U.S. and District housing markets have experienced stable growth since 2011. Declines in affordability, higher mortgage rates, higher construction costs and declines in equity prices all slowed the housing sector in 2018.
While a slowdown in the U.S. economy would reduce demand and dampen growth in the near term, supply shortages have some structural foundations—for example an older demographic of construction workers—that are likely to constrain any overbuilding if the economy continues to expand.
Endnotes
- Headquartered in St. Louis, the Eighth Federal Reserve District includes all of Arkansas and parts of Illinois, Indiana, Kentucky, Mississippi, Missouri and Tennessee.
- See www.nahb.org/en/research/housing-economics/housings-economic-impact/housings-contribution-to-gross-domestic-product-gdp.aspx.
- For more on the effect of student debt on mortgages, see www.federalreserve.gov/publications/files/consumer-community-context-201901.pdf.
- Measured as median house price divided by median family income.
- See Mather and Schlagenhauf.
- There are numerous assumptions in estimating the monthly payment on a home such as down payment amount and interest rate, and the basic premise is that a household can afford to pay 28 percent of its gross income on housing.
References
Mather, Ryan; and Schlagenhauf, Don. “Debt Levels Continue to Grow in Eighth District’s Key Metro Areas.” Regional Economist, March 7, 2019. See www.stlouisfed.org/publications/regional-economist/first-quarter-2019/debt-levels-continue-grow.
Saiz, Albert. “The Geographic Determinants of Housing Supply.” The Quarterly Journal of Economics, 2010, Vol. 125, No. 3, pp. 1253-96.


Views expressed in Regional Economist are not necessarily those of the St. Louis Fed or Federal Reserve System.
For the latest insights from our economists and other St. Louis Fed experts, visit On the Economy and subscribe.
Email Us