


Debt Levels Continue to Grow in Eighth District’s Key Metro Areas
KEY TAKEAWAYS
- For the largest metro areas in the Eighth District, the growth rate of mortgage and auto debt picked up in the third quarter of 2018.
- In the third quarter, Memphis, Tenn., saw credit card debt grow faster than the national rate.
- Data on the 90-day delinquency rate do not seem to indicate that a debt problem on the scale of the Great Recession is on the horizon.

In the previous issue of the Regional Economist, we introduced some new metrics intended to monitor consumer debt developments at the metropolitan statistical area (MSA) level in the Eighth Federal Reserve District.Headquartered in St. Louis, the Eighth Federal Reserve District includes all of Arkansas and parts of Illinois, Indiana, Kentucky, Mississippi, Missouri and Tennessee. Since then, the Federal Reserve Bank of New York has updated its Consumer Credit Panel to include data from the third quarter of 2018.
In this article, we examine the new data to see whether any significant developments have occurred either nationally or in the Eighth District’s major MSAs. We also report on our efforts to expand the sample of MSAs we are tracking.
National Developments
In the U.S. as a whole, we observe small increases in the year-over-year rate at which consumers were accumulating inflation-adjusted auto and mortgage debtAll data were adjusted for inflation using the personal consumption expenditures chain-type price index. from the second quarter of 2018 to the third quarter of 2018. Given that these categories represent a large portion of all consumer debt, the rate of total debt accumulation across the nation was also increasing. However, the rate of credit card debt accumulation declined, and the outstanding amount of home equity line of credit (HELOC) debt continued to decline since the second quarter.
Eighth District MSAs
Debt developments are shown in Figure 1 for the four largest MSAs in our district: St. Louis; Memphis, Tenn.; Louisville, Ky.; and Little Rock, Ark.
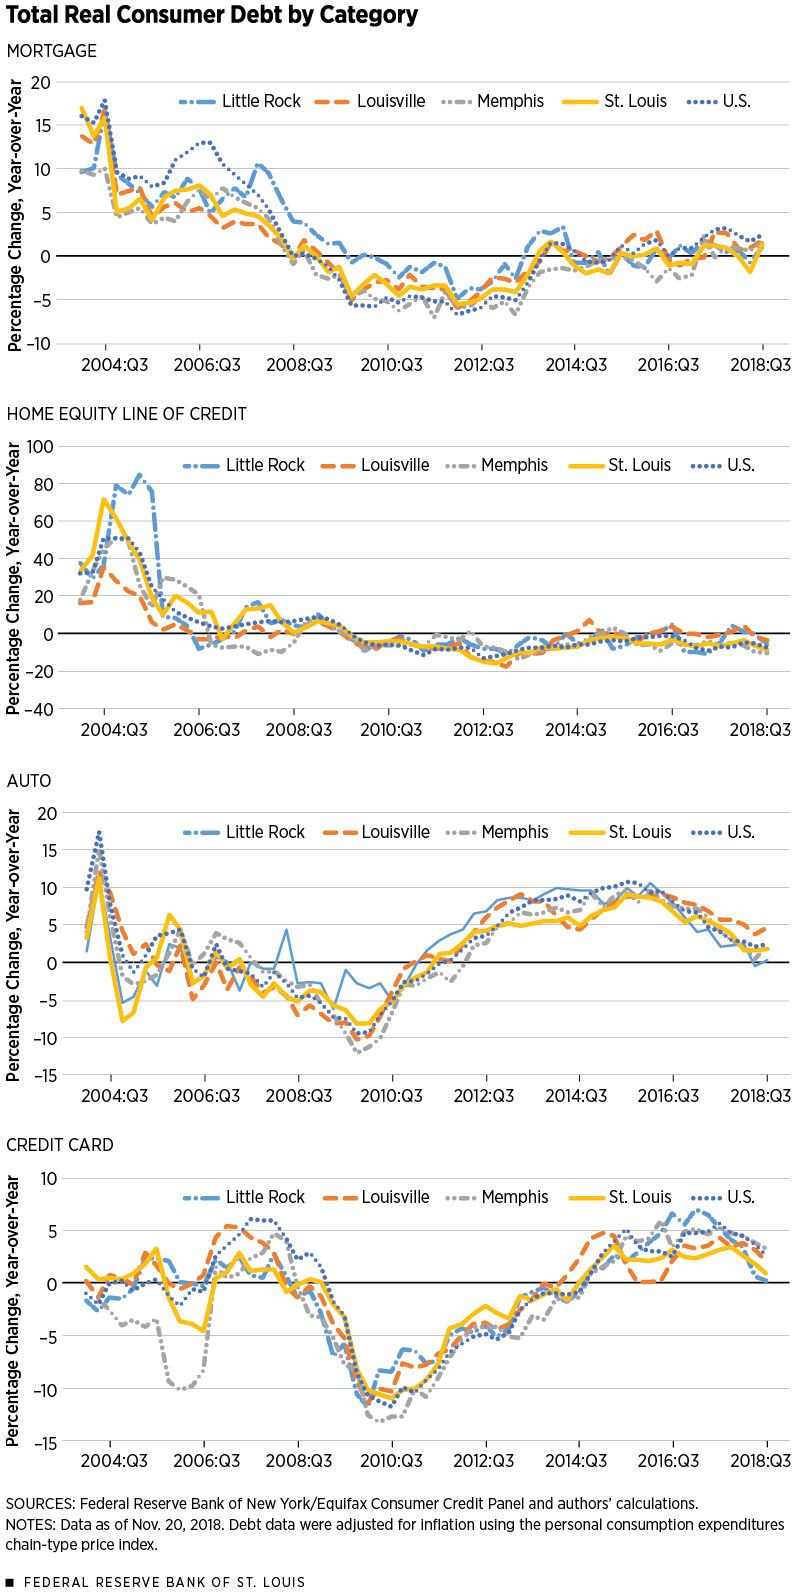
Mortgage debt declined significantly following the Great Recession, both nationally and in the Eighth District, but started a sustained increase once again in 2015. In the second quarter of 2018, the growth of mortgage debt looked to be slowing in several MSAs. However, the most recent data suggest that the slowdown was temporary. Nationally, mortgage debt accrual increased from 1.64 percent in the second quarter to 2.54 percent in the third. In the Eighth District MSAs, mortgage debt since 2015 has tended to be below the national trend.
Prior to the Great Recession, the growth rate in HELOC debt exceeded the growth rate in mortgage debt, both nationally and in these District MSAs. In late 2004, the growth rate of HELOC debt in St. Louis and Little Rock was particularly large, actually exceeding the national growth rate in this category. Since around 2010, however, the trend in HELOC debt has largely remained negative for both the national and District MSA economies. Little Rock and Louisville appear to have the greatest volatility in this category.
Nationally, the growth of auto debt peaked before 2005 and declined until early 2010. Between 2010 and 2015, the year-over-year growth rate in auto debt steadily increased. Since that time, however, auto debt growth has been slowing. Most recently, the declines in auto debt accrual have been greatest in Little Rock, while auto debt growth in Louisville has exceeded national rates.
Credit card debt has the same general pattern in the MSAs as observed in the overall economy. The most recent data show that credit card debt is growing more slowly than the national trend in every District MSA except Memphis.
In Table 1, we present the underlying data by debt category in each of these four MSAs for the second and third quarters of 2018.
| Metropolitan Statistical Area | Debt Type | Year-over-Year Percentage Change in Debt | Year-over-Year Percentage Point Difference in Delinquency Rates | ||||
|---|---|---|---|---|---|---|---|
| 2018:Q2 | 2018:Q3 | 2018:Q2 | 2018:Q3 | ||||
| Little Rock, Ark. | Mortgage | -0.82% | 1.09% | -0.01 | -0.05 | ||
| HELOC | -0.28% | -5.70% | -0.24 | 0.19 | |||
| Auto | -0.46% | 0.26% | 0.32 | 0.47 | |||
| Credit Card | 0.60% | 0.17% | 0.78 | 0.53 | |||
| Louisville, Ky. | Mortgage | 0.99% | 1.92% | -0.46 | -0.34 | ||
| HELOC | -1.81% | -3.52% | -0.58 | -0.57 | |||
| Auto | 3.79% | 4.71% | 0.24 | 0.12 | |||
| Credit Card | 3.11% | 2.11% | 0.23 | 0.32 | |||
| Memphis, Tenn. | Mortgage | 0.59% | 1.51% | -0.26 | -0.40 | ||
| HELOC | -9.87% | -10.13% | 0.04 | -0.66 | |||
| Auto | 0.42% | 2.28% | -0.44 | -0.04 | |||
| Credit Card | 3.32% | 3.65% | 0.31 | 0.29 | |||
| St. Louis | Mortgage | -1.87% | 1.39% | -0.31 | -0.26 | ||
| HELOC | -6.32% | -8.86% | -1.09 | -0.88 | |||
| Auto | 1.61% | 1.83% | 0.30 | 0.18 | |||
| Credit Card | 1.76% | 0.91% | -0.20 | -0.15 | |||
| SOURCES: Federal Reserve Bank of New York/Equifax Consumer Credit Panel and authors’ calculations. | |||||||
| NOTES: HELOC is home equity line of credit debt. Debt data were adjusted for inflation using the personal consumption expenditures chain-type price index; all data as of Nov. 20, 2018. | |||||||
A Check on Debt Problems
As we have argued previously, an increase or even a sustained increase in any debt category does not necessarily signal a potential problem as long as debtors demonstrate an ability to repay. To provide clarity, then, in Table 1 we also monitored 90-day delinquency rates by debt category in the various MSAs.We derive the 90-day delinquency rate by dividing the volume of loan payments that are 90 days or more past due by the total volume of loan payments. The idea is that sustained, large increases in both consumer debt and the corresponding delinquency rate are a signal of a possible consumer debt problem. Recall that during the early periods of the Great Recession, the year-to-year growth in the 90-day mortgage delinquency rate began exceeding 1 percentage point nationally and continued to do so for 11 straight quarters. As can be seen in Table 1, year-to-year growth in the 90-day delinquency rate did not come close to exceeding 1 percentage point for any debt category in any of the MSAs examined. Therefore, the data do not seem to indicate that another debt problem is on the horizon.
Smaller MSAs in the District
After our previous article, some readers expressed interest in other MSAs of the Eighth District. In response, we constructed a data set for the MSAs of Evansville, Ind.; Fayetteville-Springdale, Ark.; Jackson, Tenn.; and Springfield, Mo. (See Table 2.) There is likely a slight decrease in accuracy for these numbers as compared with those of larger MSAs because of the smaller sample size.
| Metropolitan Statistical Area | Debt Type | Year-over-Year Percentage Change in Debt | Year-over-Year Percentage Point Difference in Delinquency Rates | ||||
|---|---|---|---|---|---|---|---|
| 2018:Q2 | 2018:Q3 | 2018:Q2 | 2018:Q3 | ||||
| Evansville, Ind. | Mortgage | -0.22% | 1.81% | -0.37 | -0.25 | ||
| HELOC | -10.60% | 2.16% | 0.27 | 0.16 | |||
| Auto | 2.14% | 0.59% | 0.65 | 0.38 | |||
| Credit Card | -0.53% | -0.03% | 0.10 | 0.18 | |||
| Fayetteville-Springdale, Ark. | Mortgage | -0.12% | 4.29% | -0.01 | -0.31 | ||
| HELOC | 4.34% | 6.72% | 0.22 | 0.60 | |||
| Auto | 3.66% | 4.64% | 0.08 | 0.13 | |||
| Credit Card | 8.08% | 6.01% | 0.04 | -0.31 | |||
| Jackson, Tenn. | Mortgage | 1.09% | -4.09% | -0.73 | -0.42 | ||
| HELOC | 4.97% | -11.08% | 0.00 | 0.00 | |||
| Auto | 4.77% | 4.99% | -0.23 | -0.02 | |||
| Credit Card | 6.27% | 1.09% | 0.94 | 0.66 | |||
| Springfield, Mo. | Mortgage | 2.83% | 4.44% | -0.09 | 0.05 | ||
| HELOC | -5.71% | -5.88% | -0.20 | -0.51 | |||
| Auto | 4.66% | 4.65% | 0.06 | 0.07 | |||
| Credit Card | 1.35% | -1.05% | -0.10 | 0.19 | |||
| SOURCES: Federal Reserve Bank of New York/Equifax Consumer Credit Panel and authors’ calculations. | |||||||
| NOTES: HELOC is home equity line of credit debt. Debt data were adjusted for inflation using the personal consumption expenditures chain-type price index; all data as of Nov. 20, 2018. | |||||||
Generally, all these MSAs showed the same national trend of accelerating total debt growth in the third quarter except for Jackson, where the total change in overall debt was actually negative in the third quarter.
We will focus on the Fayetteville-Springdale MSA because it has recently been among the fastest-growing MSAs in the U.S. In the second quarter of 2018, mortgage debt for this MSA declined. In the third quarter, however, mortgage debt increased by 4.29 percent compared with that in the third quarter of 2017, reflecting a strong housing market. In addition, HELOC debt increased by over 4 percentage points in this market for each of the quarters presented here. Credit card and auto debt increased by 4.6 and 6.0 percent, respectively. In all categories, third-quarter debt growth was faster in the Fayetteville-Springdale MSA than the national average change. Delinquency growth rates were below the one percentage point threshold for all categories.
Endnotes
- Headquartered in St. Louis, the Eighth Federal Reserve District includes all of Arkansas and parts of Illinois, Indiana, Kentucky, Mississippi, Missouri and Tennessee.
- All data were adjusted for inflation using the personal consumption expenditures chain-type price index.
- We derive the 90-day delinquency rate by dividing the volume of loan payments that are 90 days or more past due by the total volume of loan payments.


Views expressed in Regional Economist are not necessarily those of the St. Louis Fed or Federal Reserve System.
For the latest insights from our economists and other St. Louis Fed experts, visit On the Economy and subscribe.
Email Us