


Our Community Investment Explorer Data Tool Gets an Upgrade
Community and economic development finance programs can create meaningful opportunities for underserved populations and communities. There are some good examples of the real-world impacts of community and economic development (CED) funding issued between 2016 and 2023:
- Through a $10 million New Markets Tax Credit investment, Our House, a nonprofit in central Arkansas, was able to significantly expand its services for people without housing.
- Financing from a local community development financial institution, River City Capital Investment, allowed Leatrice Franklin, a small business owner in Memphis, Tenn., to purchase supplies for her medical uniform company, The Skrub Kafe Network.
- Community Development Block Grant funding of $10 million enabled the construction of the Joplin Early Childhood center, which serves hundreds of low- and moderate-income (LMI) families in Joplin, Mo.
Community Investment Explorer Tool Tracks Community Funding
Given the importance of CED capital in shaping opportunities for households and communities, the St. Louis Fed offers a Community Investment Explorer (CIE) interactive data tool to examine the distribution of funding at the state, regional and neighborhood levels.
What the Community Investment Explorer Does
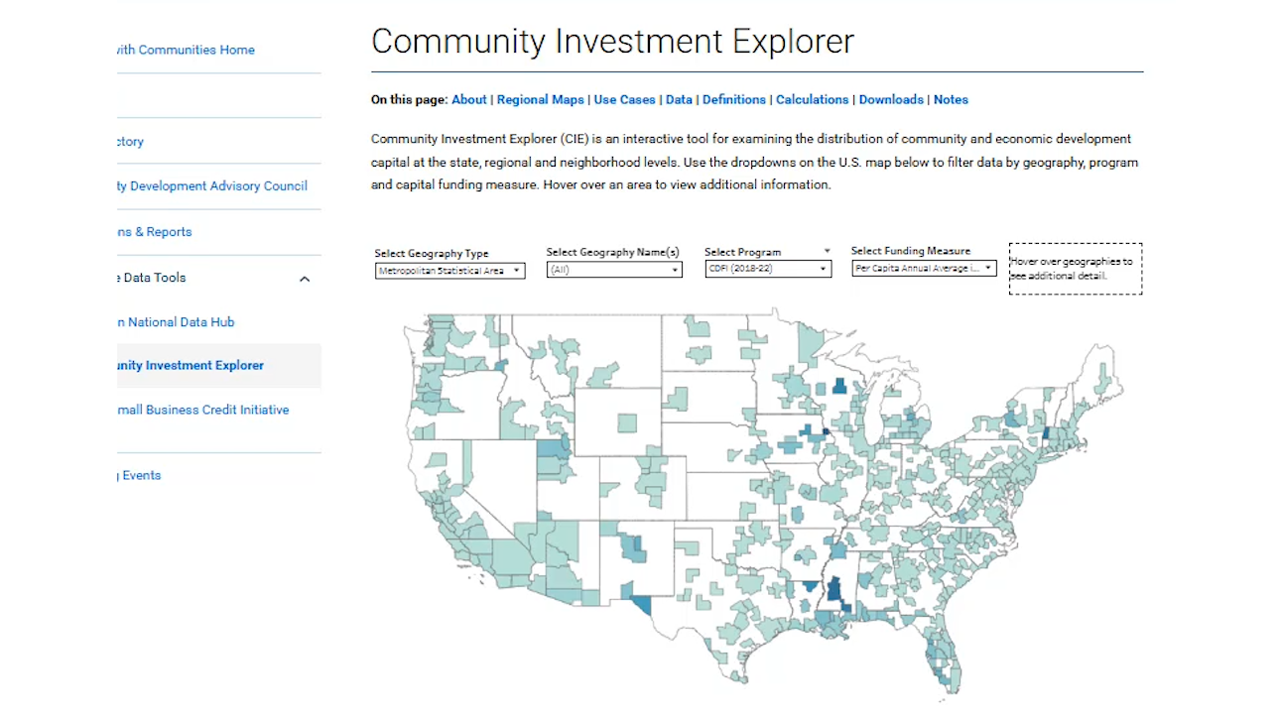
The interactive Community Investment Explorer data tool shows the distribution of community and economic development funding in the U.S. Users can view the data in a map or a trend graph.
Captions:
Federal Reserve Bank of St. Louis
Community Investment Explorer
Filter by geography, program and funding measure
In the Community Investment Explorer tool, you can look at data by… geography name(s), program or funding measure. You can also see statewide data.
Drill down further to see funding at the neighborhood level for St. Louis, Memphis, Louisville and Little Rock.
Let’s check out St. Louis. Hover over areas to see the data.
You can also view the data for all the U.S. areas as a trend graph.
Community Investment Explorer
www.stlouisfed.org/community-development/data-tools/community-investment-explorer
The tool serves two main objectives: first, to provide practitioners with a better understanding of funding hot spots and gaps across geographies and programs, and second, to equip researchers with a comprehensive dataset to explore timely and relevant research questions. This is made possible by federal government agencies making data on their programs publicly available. (See box for information on the agencies, programs and their initials.)
One of the primary benefits of the CIE is its project- and program-based view of where CED funding was deployed, including to LMI areas of a region.
To enhance the most popular features of the tool while addressing its limitations, we recently released the third version of our Community Investment Explorer. The updated version visualizes the flow of CED capital across nine programs over a five-year period.Data from three of the 12 programs included in the earlier version of the CIE are no longer available and are not included. To create the tool, the most recent five years of available data for each program between 2016 and 2023 were analyzed, with the majority of data on funding between 2018 and 2022. Key updates and features include:
- Updated data with amounts adjusted for inflation and presented in 2022 dollars
- Data for funding flows in rural, noncore-based statistical areas of states in addition to those for funding flows in metropolitan and micropolitan areasAccording to Office of Management and Budget definitions, metropolitan statistical areas include at least one urbanized area of 50,000 or more inhabitants and micropolitan statistical areas include at least one urban cluster of at least 10,000 but fewer than 50,000 people.
- Funding trends by program over time
- New measures, such as funding per capita and funding-to-population ratio in LMI areas, to compare funding patterns across geographies
A New Way to Measure CED Funding across Geographies
The updated Community Investment Explorer introduces a metric called the funding-to-population ratio as a standard measure of funding across different geographies. The ratio allows users to compare CED funding levels in subgeographies, or smaller areas such as LMI neighborhoods or rural areas, across regions and states.
The funding-to-population ratio for LMI funding is calculated by dividing the percentage of funding that goes to a geography’s LMI neighborhoods by the percentage of the population living in those LMI neighborhoods. This accounts not only for differences in funding amounts but also for differences in the demographic composition of LMI areas. A funding-to-population ratio value of 1 indicates that the share of funding matches the share of the population in LMI neighborhoods. A value above 1 means funding is overrepresented relative to the LMI population, while a value below 1 signifies funding is underrepresented. Given that many programs in the CIE aim to direct resources to underinvested communities, we would expect to see funding-to-population ratios above 1 in LMI areas.
Comparing LMI Funding-to-Population Ratios: Eighth District vs. National
The CIE data reveal that within the Federal Reserve’s Eighth District, CED funding is generally more concentrated in LMI neighborhoods compared with the national average.The Eighth Federal Reserve District includes all of Arkansas, most of Missouri, and parts of Illinois, Indiana, Kentucky, Mississippi and Tennessee. The most recent five years of available data for each program in the period from 2016 to 2023 were analyzed. The funding-to-population ratio shows that nearly every program allocates a greater proportion of resources to LMI communities in the Eighth District than they do to LMI communities in the U.S. overall, as shown for the programs included in the figure below. The two exceptions are the Historic Tax Credit and block grant programs.
Except for the Historic Tax Credit and CRA Small Business lending programs, funding is overrepresented in LMI areas of the Eighth District, with the Low-Income Housing Tax Credit, HOME Investment Partnership and New Markets Tax Credit programs showing the highest funding-to-population ratios. While this suggests these programs are effectively targeting lower-income communities, the high ratio for the housing tax credit program could indicate a potential concentration of affordable housing in lower-income neighborhoods, which could impede upward economic mobility (PDF).
Funding Patterns across Metropolitan, Micropolitan and Rural Areas
The CIE data reveal both similarities and differences in how CED funding is allocated across geographic types (metro, micro and rural areas) in the Eighth District compared with the U.S. overall.
Some programs have clear geographic patterns: For example, the Historic Tax Credit and Small Business Administration programs tend to concentrate funding more in urban metro areas, as the figure below shows.
Additionally, the SBA programs, HOME program, and CRA SB show similar distributions across metro, micro and rural areas in both the Eighth District and U.S.
However, there are noteworthy differences in funding across geographies within the Eighth District compared to the nation. Micropolitan areas in the Eighth District, for example, receive a higher relative amount of CDFI funding than their national counterparts, as the figure below shows, while rural and metro areas in the U.S. see higher CDFI investment compared with the Eighth District. Additionally, the NMTC program allocates a much smaller relative share to rural and micro areas in the Eighth District compared with the U.S., and a slightly greater share to metro areas in the District compared with the U.S.
In the Eighth District, the CDBG program appears to prioritize funding in less-populated rural areas to a greater degree than the U.S. overall, with a rural funding-to-population ratio of 1.43 compared to just 0.93 nationally, as the last figure shows.
Funding Trends
The CIE allows users to visualize funding trends across programs and geographies over a five-year period. Some key highlights include:
- CDFI investment and lending surged over 100% both across the nation and the Eighth District.The CDFI data are based on a sample of institutions that receive grants from the CDFI Fund. The composition of this sample can change over time, which may impact funding trends observed. Historic Tax Credit investments declined slightly nationwide but dropped 76% in the Eighth District from 2018 to 2022.
- While SBA 7(a) lending was stable across the U.S. and the Eighth District, micropolitan areas in the Eighth District saw a 33% increase between 2019 and 2023.
- NMTC investment in LMI communities declined slightly nationally but increased by 33% in Eighth District LMI communities between 2018 and 2022.
- CDBG grantmaking increased slightly in LMI communities nationally but declined by 28% in Eighth District LMI communities between 2018 and 2022.
The data and analysis presented in the CIE shine a light on the real-world impact of CED capital across the nation and within the St. Louis Fed’s District. Our House, Leatrice Franklin and the Joplin Early Childhood center are examples of the meaningful opportunities financing programs create for underserved populations and communities. By providing a granular, project- and program-level view of CED capital flows, practitioners and researchers can use the updated CIE to gain crucial insights on funding patterns, identify gaps and inform strategies to more effectively channel capital to the communities and populations that have the greatest need.
This blog post was updated Aug. 20, 2025, with the addition of a video and the conversion of still charts to interactive charts.
Notes
- Data from three of the 12 programs included in the earlier version of the CIE are no longer available and are not included. To create the tool, the most recent five years of available data for each program between 2016 and 2023 were analyzed, with the majority of data on funding between 2018 and 2022.
- According to Office of Management and Budget definitions, metropolitan statistical areas include at least one urbanized area of 50,000 or more inhabitants and micropolitan statistical areas include at least one urban cluster of at least 10,000 but fewer than 50,000 people.
- The Eighth Federal Reserve District includes all of Arkansas, most of Missouri, and parts of Illinois, Indiana, Kentucky, Mississippi and Tennessee. The most recent five years of available data for each program in the period from 2016 to 2023 were analyzed.
- The CDFI data are based on a sample of institutions that receive grants from the CDFI Fund. The composition of this sample can change over time, which may impact funding trends observed.

This blog explains everyday economics and the Fed, while also spotlighting St. Louis Fed people and programs. Views expressed are not necessarily those of the St. Louis Fed or Federal Reserve System.
Email Us