


What Causes “Jumps” in Stock Prices?
Sometimes stock prices move a lot in a very short amount of time compared with their usual movements. These big changes are known as jumps in stock prices. Economists often attribute these jumps to important news that changes the expectations of market participants about the future profitability of firms, path of interest rates or state of the economy. Studying such jumps helps us understand what sort of news is important to shaping market expectations and, therefore, how markets work.
We calculated 638 jumps in the price of the Dow Jones Industrial Average ETF (SPDR) using millisecond-precision data from the New York Stock Exchange Trade and Quote database that span Jan. 3, 2007, through April 2, 2020.For details on data and jump calculations, see Federal Reserve Bank of St. Louis Working Paper 2024-006A, “Sluggish News Reactions: A Combinatorial Approach for Synchronizing Stock Jumps,” by Nabil Bouamara, Kris Boudt, Sébastien Laurent and Christopher J. Neely. This period includes several turbulent episodes: the global housing and credit crisis; the European sovereign debt crisis and the bailout of Greece; the Russian, Greek, Turkish crisis; and the 2020 stock market crash.
One can examine the causes of jumps in several ways. One can look at long-term patterns by year or quarter to see whether there are periods with an unusual number of jumps. One can also look for unusual patterns by day in the month, by day of the week, by time of day and with the times of known macroeconomic announcements, such as monetary policy announcements or employment reports.
The figure below shows the number of jumps by quarter of the sample. On average, there are about 12 jumps per quarter. The first quarter of 2007, the second half of 2017, and July through November 2019 produced many jumps compared with the rest of the sample. The initial inklings of problems in the U.S. housing and subprime mortgage sectors, which would later become the Great Financial Crisis of 2007-09, triggered a sharp stock sell-off in March 2007. Money market turbulence characterized the latter half of 2019.
Number of Stock Price Jumps Measured by Quarter, 2007:Q1-2020:Q1
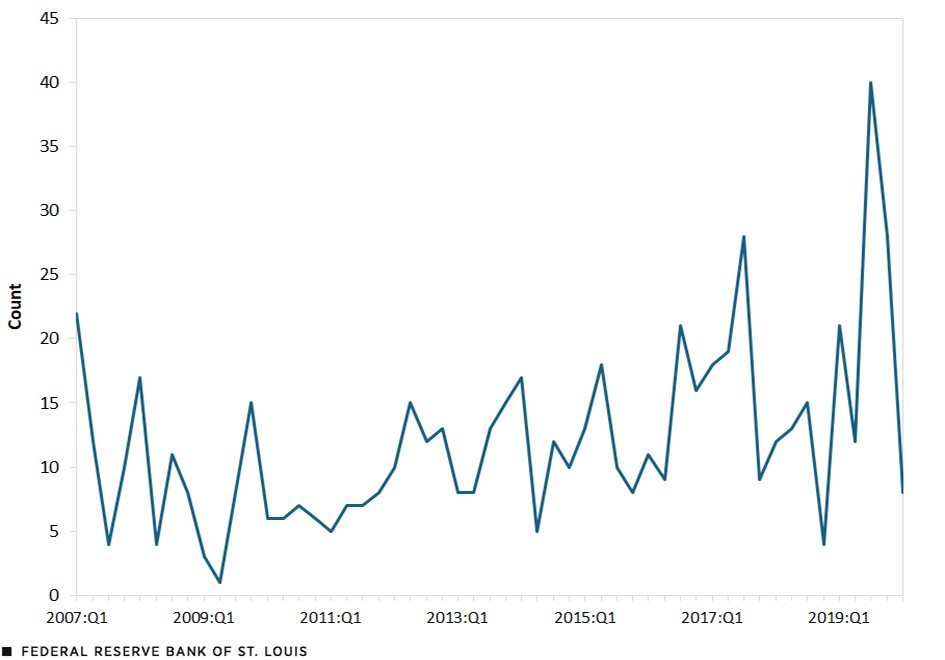
SOURCE: Bouamara, Boudt, Laurent and Neely (2024).
We also looked at whether stock price jumps occurred shortly after 52 types of macroeconomic announcements,The 52 announcement types are as follows: FOMC Announcement, FOMC Minutes Releases, ISM Manufacturing, Census Bureau Construction Spending, Langer Research Consumer Comfort Index, Kansas City Fed Manf. Activity, U. of Mich. Surveys of Consumers, NAHB Housing Market Index, Richmond Fed Manf. Index, U.S. Census Bureau Business Inventories, National Assoc. of REALTORS Existing-Home Sales, Conf. Board Leading Index, S&P Global Manf. PMI, Mortgage Bankers Assoc. Mortgage Delinquencies, Langer Research Economic Expectations Index, Conf. Board Consumer Confidence, Federal Budget Balance, Retail Economist-Goldman Sachs Chain Store Sales, National Assoc. of REALTORS Pending Home Sales (MoM), Philadelphia Fed Business Outlook, ISM Chicago Business Barometer, Federal Reserve G.19 Consumer Credit, U.S. Census Bureau Factory Orders, Federal Reserve Z.1 Household Change in Net Worth, Investors Business Daily and TechnoMetrica Economic Optimism Index, ISM New Orders, ISM Non-Manf. Composite Index, U.S. Census Bureau New Home Sales, National Assoc. of REALTORS Pending Home Sales (YoY), U.S. Census Bureau Wholesale Inventories, U.S. Census Bureau Capital Goods, U.S. Census Bureau Capital Goods Shipments, Federal Reserve G.17 Capacity Utilization, Conf. Board Consumer Expectations, Conf. Board Consumer Confidence Present Situation, U.S. Census Bureau Annual Revisions in Construction Spending, Dallas Fed Manf. Activity, U.S. Census Bureau Durable Goods, U.S. Census Bureau Durable Goods ex. Transportation, FHFA House Price Index, U.S. Census Bureau Factory Orders ex. Transportation, Federal Reserve Beige Book, ISM Manf. Employment, ISM PMI-Milwaukee, ISM Services Index, Federal Reserve G.17 Industrial Production, Federal Reserve Labor Market Conditions Indicators, Federal Reserve G.17 Manf. Production Index, S&P Global Composite PMI, S&P Global Services PMI, Treasury Statement, and U.S. Census Bureau Wholesale Trade. which include measures of monetary policy, labor market activity, price levels and trade and surveys of economic activity. The table below lists the types of news that were associated with at least five jumps. We considered a jump to be associated with an announcement if it occurred within 30 minutes of the announcement.
| Event | Number of Jumps Associated with All Such Events | Number of Events Associated with at Least One Jump | Number of Announcements | Probability of a Stock Jump |
|---|---|---|---|---|
| FOMC Announcement | 140 | 66 | 114 | 0.579 |
| FOMC Releases Minutes | 18 | 16 | 103 | 0.155 |
| ISM Manufacturing | 15 | 12 | 159 | 0.075 |
| Census Bureau Construction Spending | 14 | 11 | 158 | 0.070 |
| Langer Research Consumer Comfort Index | 12 | 12 | 686 | 0.017 |
| Kansas City Fed Manufacturing Activity | 6 | 6 | 102 | 0.059 |
| University of Michigan Surveys of Consumers | 6 | 6 | 316 | 0.019 |
| NAHB Housing Market Index | 5 | 4 | 158 | 0.025 |
| Richmond Fed Manufacturing Index | 5 | 5 | 158 | 0.032 |
| SOURCES: Bouamara, Boudt, Laurent and Neely (2024). | ||||
| NOTES: The columns in the table show: 1) the announcement type; 2) how many stock jumps occurred within the announcement windows for the type of announcement; 3) how many announcements of the type occurred coincidentally with jumps (this number is generally less than column 2 because a single event can produce more than one jump); 4) how many announcements of the type are in the sample; 5) the probability of a stock jump given the announcement (this is column 3 divided by column 4). | ||||
Some announcements created more than one jump. For example, the first row of the table shows that 66 Federal Open Market Committee (FOMC) announcements were associated with 140 jumps.
News from the FOMC about monetary policy was most important in explaining jumps. FOMC announcements that included unconventional monetary policy changes tended to be particularly important, probably because many such announcements have been substantial policy surprises. For announcements with at least five stock jumps, 138 individual announcements were associated with 221 jumps.
Because FOMC meetings usually end on Wednesdays—when most decisions are announced—and such meetings have an annual pattern that includes eight meetings, the importance of FOMC news means that the data show many jumps on Wednesdays, as well as at the times of FOMC meetings in mid-March, very late July and mid-September.
Fiscal announcements sometimes produce large jumps in stock prices, but these don’t occur at regular times like monetary or macroeconomic announcements, so it was more difficult to systematically identify many jumps with fiscal policy.
The large number of jumps in the third quarter of 2017 and the second half of 2019 merit some discussion. The turbulence in the third quarter of 2017 appears to have been related to heightened tensions about the North Korean nuclear program.See the Aug. 9, 2017, New York Times article “Stocks Fall as Tensions Rise between U.S. and North Korea.” In the second half of 2019, a confluence of individually unremarkable events related to Federal Reserve balance sheet policy, corporate tax payments, Treasury issuance and bank regulation combined to create severe liquidity problems in money markets (short-term bond markets) that likely spilled over to equity markets, creating jumps in stock prices.See Sriya Anbil, Alyssa Anderson and Zeynep Senyuz’s Feb. 27, 2020, FEDS Notes article, “What Happened in Money Markets in September 2019?”
In summary, stock prices sometimes exhibit very large changes. Many of these seem to be clearly associated with important announcements that change expectations about future earnings and the state of the economy and/or interest rates. Others seem to be associated with market strains, such as the Great Financial Crisis of 2007-09 or money market turbulence in the latter half of 2019. But many more jumps are not obviously associated with any scheduled announcement or known cause.
Notes
- For details on data and jump calculations, see Federal Reserve Bank of St. Louis Working Paper 2024-006A, “Sluggish News Reactions: A Combinatorial Approach for Synchronizing Stock Jumps,” by Nabil Bouamara, Kris Boudt, Sébastien Laurent and Christopher J. Neely.
- The 52 announcement types are as follows: FOMC Announcement, FOMC Minutes Releases, ISM Manufacturing, Census Bureau Construction Spending, Langer Research Consumer Comfort Index, Kansas City Fed Manf. Activity, U. of Mich. Surveys of Consumers, NAHB Housing Market Index, Richmond Fed Manf. Index, U.S. Census Bureau Business Inventories, National Assoc. of REALTORS Existing-Home Sales, Conf. Board Leading Index, S&P Global Manf. PMI, Mortgage Bankers Assoc. Mortgage Delinquencies, Langer Research Economic Expectations Index, Conf. Board Consumer Confidence, Federal Budget Balance, Retail Economist-Goldman Sachs Chain Store Sales, National Assoc. of REALTORS Pending Home Sales (MoM), Philadelphia Fed Business Outlook, ISM Chicago Business Barometer, Federal Reserve G.19 Consumer Credit, U.S. Census Bureau Factory Orders, Federal Reserve Z.1 Household Change in Net Worth, Investors Business Daily and TechnoMetrica Economic Optimism Index, ISM New Orders, ISM Non-Manf. Composite Index, U.S. Census Bureau New Home Sales, National Assoc. of REALTORS Pending Home Sales (YoY), U.S. Census Bureau Wholesale Inventories, U.S. Census Bureau Capital Goods, U.S. Census Bureau Capital Goods Shipments, Federal Reserve G.17 Capacity Utilization, Conf. Board Consumer Expectations, Conf. Board Consumer Confidence Present Situation, U.S. Census Bureau Annual Revisions in Construction Spending, Dallas Fed Manf. Activity, U.S. Census Bureau Durable Goods, U.S. Census Bureau Durable Goods ex. Transportation, FHFA House Price Index, U.S. Census Bureau Factory Orders ex. Transportation, Federal Reserve Beige Book, ISM Manf. Employment, ISM PMI-Milwaukee, ISM Services Index, Federal Reserve G.17 Industrial Production, Federal Reserve Labor Market Conditions Indicators, Federal Reserve G.17 Manf. Production Index, S&P Global Composite PMI, S&P Global Services PMI, Treasury Statement, and U.S. Census Bureau Wholesale Trade.
- See the Aug. 9, 2017, New York Times article “Stocks Fall as Tensions Rise between U.S. and North Korea.”
- See Sriya Anbil, Alyssa Anderson and Zeynep Senyuz’s Feb. 27, 2020, FEDS Notes article, “What Happened in Money Markets in September 2019?”


Citation
Christopher J. Neely, Anna Cole, Nabil Bouamara, Kris Boudt and Sébastien Laurent, ldquoWhat Causes “Jumps” in Stock Prices?,rdquo St. Louis Fed On the Economy, Sept. 29, 2025.
This blog offers commentary, analysis and data from our economists and experts. Views expressed are not necessarily those of the St. Louis Fed or Federal Reserve System.
Email Us
All other blog-related questions