


Is the U.S. in an Above-Target Inflation Regime?
Since January 2012, the Federal Reserve has adopted an explicit target of 2% inflation, measured as the 12-month change in the personal consumption expenditures (PCE) price index.As articulated in the Federal Open Market Committee’s most recent Statement on Longer-Run Goals and Monetary Policy Strategy, a target of 2% annual inflation “is most consistent over the longer run with the Federal Reserve’s statutory maximum employment and price stability mandates.” And yet, after several years of below-target inflation prior to the COVID-19 pandemic, inflation rose above 2% annually in March 2021 and has persisted above 2% ever since. According to the latest data available (August 2025), inflation remains significantly above target, at 2.7%. In previous blog posts, I have analyzed these dynamics and their likely origin. In this blog post, my analysis suggests that we may be in a persistent above-target inflation regime.
From Below-Target to Above-Target Inflation
In practice, inflation targets are meant to be achieved over some time, rather than month by month. And the expectation is that monetary policy will not let inflation deviate from its target, either by a large amount or over a prolonged period.
However, the prepandemic period was characterized by inflation significantly below target. From the adoption of the inflation target in January 2012 until the critical month of March 2021 referenced above, annual inflation averaged 1.4%. In fact, it was above the target only about 10% of the time. Removing the impact of energy prices, inflation was above target for only four months in that period.
In contrast, inflation has remained above 2% since March 2021. This pattern suggests that the COVID-19 pandemic caused a transition from a below-target inflation regime to an above-target inflation regime. In what follows, I will support this statement and provide further analysis by focusing on PCE prices excluding energy; this removes a volatile component of the price level, allowing us to better identify trends.Energy goods and services constitute only about 4% of total consumption expenditures. However, the volatile nature of energy prices introduces short-term volatility in aggregate price and inflation measures. A common approach is to remove both energy and food prices (what is known as core PCE). Though this approach may have been valid in the past, food prices have recently behaved more like other prices in the economy and have not been a particular source of short-term volatile in aggregate indexes.
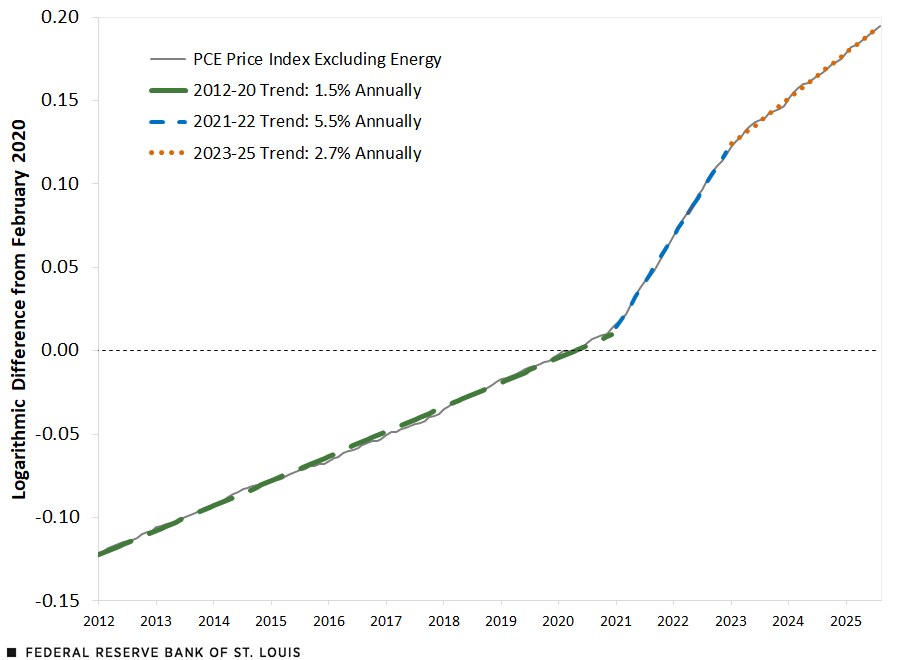
The first figure shows the PCE price index excluding energy and identifies three periods, or inflation regimes. The price level is expressed as logarithmic differences from February 2020. Hence, the numbers on the vertical axis can be interpreted as approximations to percentage deviations since the start of the COVID-19 pandemic. As we can see, the current logarithmic difference is 0.194; this means prices are now roughly 20% higher than those before the pandemic.
The figure highlights three inflation regimes by identifying trends in the price level over three distinct periods. Each regime starts at the beginning of a specific year and concludes at the end of a particular year. The trend is defined as the line that best fits the logarithm of the price index over a specific period. As the figure shows, each trend traces the price level very closely. The first regime, 2012-20, corresponds to the prepandemic era that was characterized by below-target inflation: The associated trend implies a growth pace for prices (i.e., inflation) of 1.5% annually. This trend persisted a year into the pandemic, as inflation did not start accelerating until 2021. The second regime, 2021-22, corresponds to the inflation surge associated with the pandemic period: The associated trend implies prices growing at a pace of 5.5% annually over that period. The third regime, 2023-25, characterizes the postpandemic era with above-target inflation: The associated trend implies a pace of 2.7% annually.Instead of fitting a trend on the logarithm of the price level, I could have computed the annualized inflation between the end points of each regime. Using this approach the corresponding inflation rates would have been 1.5%, 5.4% and 2.9%.
The Price Level and Three Inflation Regimes
SOURCES: Bureau of Economic Analysis and author’s calculations.
As the figure suggests, the worst impact of the pandemic on prices occurred in 2021-22. However, though inflation decelerated significantly after that, it neither returned to its prepandemic rates nor got sufficiently close to the Fed’s target. Arguably, we are now in a situation that mirrors the prepandemic era, with inflation moderately but persistently above the target.
The Above-Target Inflation Regime Is Broad-based
As I have argued in previous blog posts, the pandemic inflation surge was broad-based. Is that also the case for the above-target era?
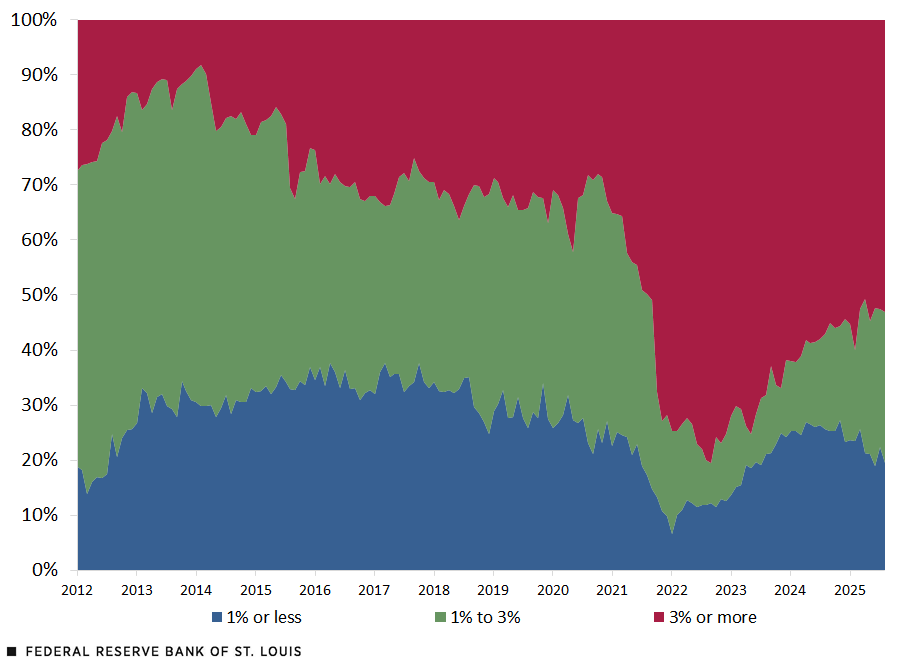
Consider sorting price changes into three groups. First, we can collect the share of consumption expenditures on products that are experiencing inflation rates well below target, say 1% annually or less. Second, we can group the share of consumption expenditures on products that are experiencing inflation rates around the inflation target, for example, rates between 1% and 3%. Finally, we can compute the share of consumption expenditures on categories that are experiencing inflation rates well above target, say 3% or more. The second figure shows these three groups, month by month.
Share of PCE Excluding Energy by Annual Inflation Rate
SOURCES: Bureau of Economic Analysis and author’s calculations.
As we can see, the prepandemic regime featured a significant share of consumption expenditures on products that experienced inflation around the target. There were also notable expenditures on products experiencing low or high inflation rates. The result, as described above, was aggregate inflation somewhat below target. But it is important to remark that the bulk of consumption products were experiencing inflation rates close to target.
The pandemic period ushered in a broad-based inflation surge. At its peak, about 80% of expenditures were on product categories with prices growing 3% or more annually. The share of products with inflation at or below target diminished considerably.
In the postpandemic period, inflationary pressures eased significantly. However, more than half of consumption expenditures are still on products experiencing 3% or more annual inflation. Moreover, the share of products with inflation around target remains low, though it has been growing in recent months.
Distribution of Inflation Remains Spread Out
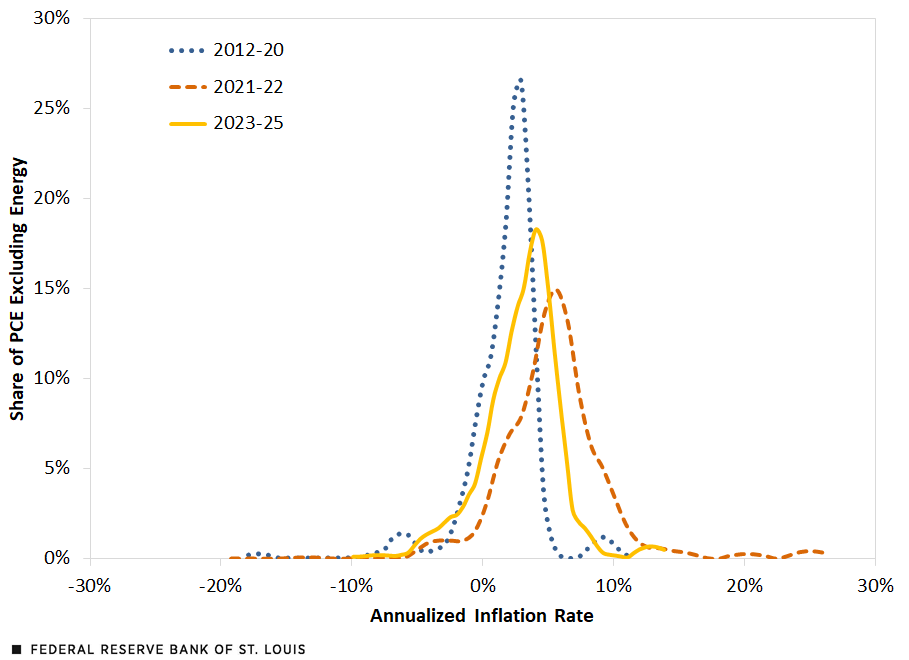
We can go a step further and analyze the full distribution of inflation across product categories.For a full description of the methodology, see my 2021 blog post “How Widespread Are Price Increases in the U.S.?” The third figure shows the distribution of inflation for the three regimes identified previously. As one can see, the distribution of inflation in 2012-20 was relatively narrow, centered close to the target. The distribution of inflation shifted considerably to the right and became more spread out during the inflation surge in 2021-22. Finally, in the postpandemic era, the distribution shifted back and narrowed somewhat, though it remains significantly to the right and more spread out than in the prepandemic era. These findings confirm that above-target inflation is a widespread phenomenon.
Estimated Distribution of Annualized PCE Excluding Energy Inflation
SOURCES: Bureau of Economic Analysis and author’s calculations.
One might be tempted to link moderately above-target inflation to the recent tariffs imposed on certain imported goods. Several analyses have concluded that the impact of tariffs so far has been modest, perhaps contributing 30 basis points to the increase in prices during 2025 (though it is also recognized that the impact may become significant in the months to come). Tariffs mainly affected durable goods, which amount to only slightly more than a tenth of total consumption expenditures. As the analysis above suggests, the share of product categories with inflation rates significantly above target far exceeds this number.
Inflation Expectations
Have these changes in inflation trends impacted expectations? This is important for the Fed as a credible inflation target can only be maintained by well-anchored longer-term inflation expectations. The table below provides averages over the three regimes for four measures of inflation expectations over the next 10 years. The first column of data shows the breakeven inflation rate derived from Treasury inflation-protected securities (TIPS), as published by FRED. The second column shows the expectations implied by inflation swaps, as published by data provider Bloomberg. The third column shows model-based inflation expectations estimated by the Cleveland Fed. The last column shows model-based inflation expectations published by the Board of Governors using the method proposed by Stefania D’Amico, Don H. Kim and Min Wei (DKW) in 2018. Importantly, all these measures provide estimates of consumer price index (CPI) inflation, not PCE inflation. Typically, the former is above the latter. Nonetheless, for our purposes, changes in these measures are more important than the levels.
| Breakeven | Swaps | Cleveland Fed | DKW Method | |
|---|---|---|---|---|
| 2012-20 | 1.9% | 2.2% | 1.7% | 2.2% |
| 2021-22 | 2.4% | 2.7% | 1.9% | 2.2% |
| 2023-25 | 2.3% | 2.5% | 2.3% | 2.7% |
| Percentage Point Change from 2012-20 to 2023-25 | 0.4 | 0.3 | 0.5 | 0.5 |
| SOURCES: FRED, Bloomberg, Federal Reserve Bank of Cleveland, Board of Governors of the Federal Reserve System and author’s calculations. | ||||
The two market-based measures of 10-year inflation expectations—breakeven and swaps—increased significantly in the 2021-22 period as inflation surged. They declined afterward but remained, on average, at levels above the prepandemic period. The model-based measures—Cleveland Fed and DKW—did not react significantly during the inflation surge of 2021-22 but subsequently increased well above their prepandemic averages. Overall, 10-year inflation expectations rose somewhere between 30 and 50 basis points, on average, from 2012-20 to 2023-25. This is smaller than the 120 basis point increase in inflation trends between the same periods (1.5% vs 2.7%), though still significant.
Conclusions
Following the inflation surge during the pandemic, prices have since been increasing at a pace significantly faster than in the prepandemic period. Just like during the inflation surge, the above-target inflation period is broad-based and not attributable to a few sectors or categories. These facts suggest the U.S. economy is in a new above-target inflation regime, which mirrors the below-target inflation regime of the prepandemic era. There are many potential explanations for this regime shift, such as the fiscal outlook. The recent imposition of tariffs has so far had a modest impact on prices and, thus, is unlikely to have contributed significantly to the current regime. Longer-run inflation expectations have reacted to this new reality but by less than actual inflation, suggesting that markets still believe the Fed will eventually deliver on its 2% inflation goal.
Notes
- As articulated in the Federal Open Market Committee’s most recent Statement on Longer-Run Goals and Monetary Policy Strategy, a target of 2% annual inflation “is most consistent over the longer run with the Federal Reserve’s statutory maximum employment and price stability mandates.”
- Energy goods and services constitute only about 4% of total consumption expenditures. However, the volatile nature of energy prices introduces short-term volatility in aggregate price and inflation measures. A common approach is to remove both energy and food prices (what is known as core PCE). Though this approach may have been valid in the past, food prices have recently behaved more like other prices in the economy and have not been a particular source of short-term volatility in aggregate indexes.
- Instead of fitting a trend on the logarithm of the price level, I could have computed the annualized inflation between the end points of each regime. Using this approach the corresponding inflation rates would have been 1.5%, 5.4% and 2.9%.
- For a full description of the methodology, see my 2021 blog post “How Widespread Are Price Increases in the U.S.?”

Citation
Fernando M. Martin, ldquoIs the U.S. in an Above-Target Inflation Regime?,rdquo St. Louis Fed On the Economy, Oct. 17, 2025.
This blog offers commentary, analysis and data from our economists and experts. Views expressed are not necessarily those of the St. Louis Fed or Federal Reserve System.
Email Us
All other blog-related questions