


Unemployment Insurance Eligibility and Benefits: An Analysis of Rules across U.S. States and Time
Unemployment insurance (UI) acts as an important safety net for recently laid-off workers. For many who have lost their jobs, the weekly benefit payments are their main source of income until they are hired again. While other social assistance programs, like the Supplemental Nutrition Assistance Program or Social Security, are primarily implemented on the federal level, unemployment insurance is designed and distributed by individual states. In this blog post, we investigate the highly disparate landscape of unemployment insurance eligibility and payment amounts across U.S. states from 1996 to 2023.
States Have Different Rules for UI Eligibility
To receive UI benefits, a laid-off worker must first qualify. A person’s eligibility upon submitting a new application is determined by both monetary and nonmonetary rules. The nonmonetary criterion assesses the reason for job loss, ensuring that the individual did not leave their job voluntarily or was not fired due to misconduct. This requirement has been a constant across states and time, except during the onset of the COVID-19 pandemic.
Monetary requirements, however, vary significantly. Applicants must meet certain earnings and employment thresholds during the base period (generally the first four of the last five completed quarters). These rules are very complex and drastically different across states and over time. While almost all states impose a minimum amount of earnings during the base period, others also impose a combination of requirements based on quarter-specific earnings and the expected weekly benefit amount.If the weekly benefit amount is below a certain threshold, the applicant can be ineligible.
To illustrate the differences in these rules across states and over time, we provide the following example. In 2005, Illinois required at least $1,600 in the base period, with at least $440 earned outside the quarter with the highest earnings in the base period. That same year, Georgia implemented criteria similar to Illinois’ rules with one notable difference: While establishing a minimum of $1,600 in the base period, the state instead required that at least $920 was earned outside of the quarter with the highest earnings. However, in 2009, Georgia eliminated earnings requirements in the base period and outside the highest quarter; instead, the state imposed a minimum earnings requirement in the two quarters with the highest earnings in the base period, as well as in the quarter with the highest earnings in that same period. This example clearly illustrates two points: (1) Even among states that implement the same eligibility rules, eligibility thresholds are different, and (2) states change these rules over time.
The Landscape of Strictness in Granting UI Eligibility
Tracking state-specific rules over time is very difficult because these rules are not available in typically used household survey data like the Current Population Survey, Panel Study of Income Dynamics, or Survey of Income and Program Participation. To address this, we digitized these rules using the Department of Labor’s Comparison of State UI Laws. Every state is tracked from 1996 to 2023, and all major monetary and nonmonetary eligibility rules are considered. Documenting the variance of requirements fills a significant gap in the academic research—our digitization is first of its kind in specificity and length.
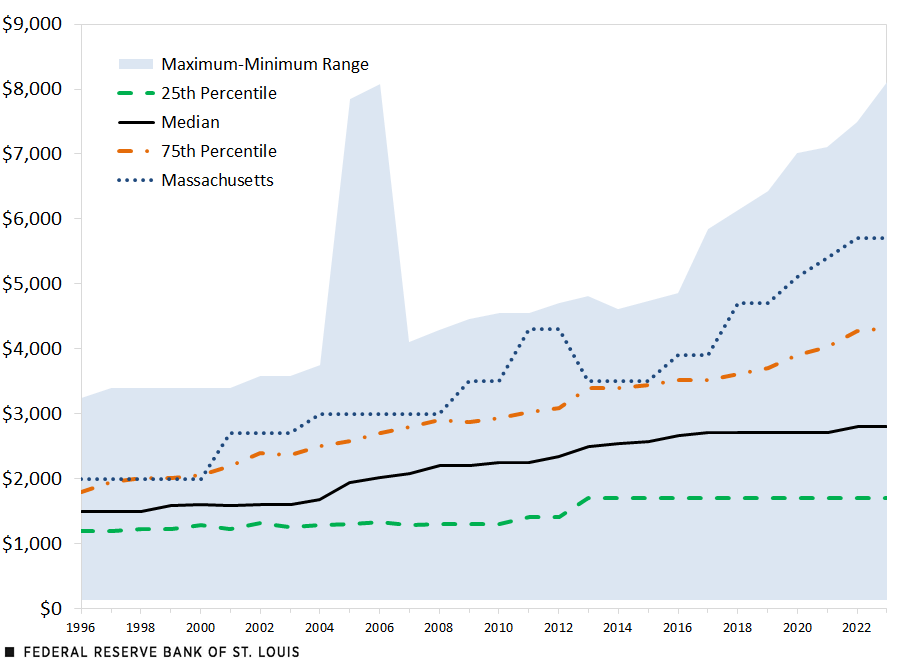
Using our data, we illustrate the differences in UI eligibility and payment amounts across states and over time. The first figure displays the minimum qualifying amount of base period earnings across states and over time. We show minimum and maximum nominal dollar amounts, as well as the median, the 25th percentile and the 75th percentile among states that implement these rules. To illustrate how this requirement can change for an individual state, we also report the eligibility amount for Massachusetts over time.
Distribution of Base Period Earnings Requirements among States and over Time
SOURCES: Department of Labor and authors’ calculations.
NOTE: Data derived from digitized state-level rules using the Department of Labor’s Comparison of State UI Laws.
We highlight two critical takeaways. First, there are large differences in minimum earnings thresholds for any given year. In 2023, Hawaii required only $130 in base period wages, while Arizona required $8,103; the median value was $2,500 (the amount required both in Colorado and in Alaska). Second, there are large and unsystematic changes within a state. For example, Massachusetts increased its base period earnings threshold by 35% in 2001 and by 23% in 2011—both of which were beyond inflationary adjustments—but reduced it by 19% in 2013.
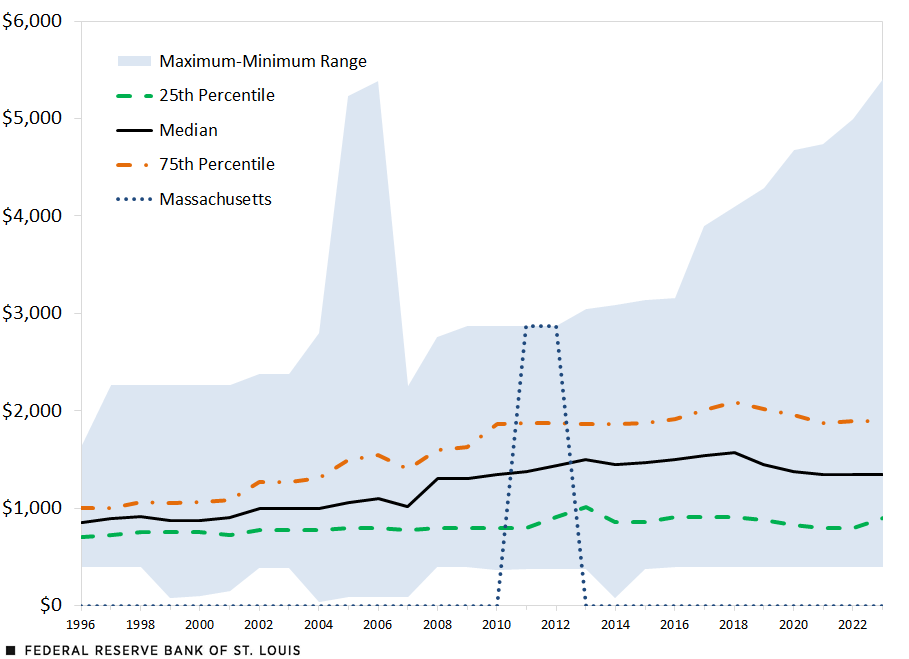
To further emphasize these points, the second figure shows the distribution of highest-quarter earnings requirements among states that implement this rule. In 2023, this requirement varied across states, from $400 in Nevada to $5,402 in Arizona, with a median value of $1,350 (Wisconsin).
The change across time for Massachusetts is sharp. In 2011, Massachusetts introduced a highest-quarter earnings requirement for the first time, setting it to $2,871; this was the maximum value across all states, but the Bay State removed this requirement altogether only two years later.
Distribution of Highest-Quarter Earnings Requirements among States and over Time
SOURCES: Department of Labor and authors’ calculations.
NOTE: Data derived from digitized state-level rules using the Department of Labor’s Comparison of State UI Laws.
The Size of Weekly Benefits Also Varies among States
Once a worker qualifies for UI, they receive a weekly benefit amount (WBA) based on a fraction of their previous earnings. States differ in their methods of computing WBA and in their maximum WBA payments. The differences are even apparent in neighboring states: Washington distributes 1.25% of base period earnings for a maximum of $783, while Oregon provides 3.85% of average earnings in the two highest-paid quarters for a maximum of $999.
The third figure shows the distribution of maximum weekly benefit amounts among states. The distribution in 2023 was quite wide, spanning from $1,015 in Massachusetts to $235 in Mississippi. There was some clustering around the median of $532 (Idaho).
Distribution of Maximum Weekly UI Benefit Amount among States and over Time

SOURCES: Department of Labor and authors’ calculations.
NOTE: Data derived from digitized state-level rules using the Department of Labor’s Comparison of State UI Laws.
Implications of Our Findings
Simply put, whether a worker will qualify for UI depends strongly on where that person lives. The amount workers receive as a percentage of lost earnings also varies by their state. This is significant, as UI acts as a backstop and a last-resort income source for many newly unemployed Americans.
When governments design UI policy, they weigh the help of UI payments to jobless individuals against the negative effects of offering them too much money, which may encourage UI recipients to reduce their job search activities or to not accept potential job offers. Our findings raise a very important research question: Which state is closest to having the best UI eligibility and payment amount rules that maximize the overall well-being of its people while taking into account this trade-off? We are currently working on a new research paper (PDF) that tries to answer this question.
Note
- If the weekly benefit amount is below a certain threshold, the applicant can be ineligible.


Citation
Serdar Birinci, Kurt See and Gus Gerlach, ldquoUnemployment Insurance Eligibility and Benefits: An Analysis of Rules across U.S. States and Time,rdquo St. Louis Fed On the Economy, June 3, 2025.
This blog offers commentary, analysis and data from our economists and experts. Views expressed are not necessarily those of the St. Louis Fed or Federal Reserve System.
Email Us
All other blog-related questions