


Economic Sentiment and the Role of the Labor Market
In an earlier blog post, I described how consumer sentiment in the U.S. has remained below pre-COVID-19 pandemic levels—and near the lower range of its historical variation—after declining in the first part of 2020.The Index of Consumer Sentiment, which is derived from the University of Michigan’s Surveys of Consumers, is also published for three income categories: the bottom 33%, the middle 33% and the top 33%. My statement about sentiment levels holds for each income category. In May 2025, the indexes for each income category were 32, 37 and 33 points, respectively, below their values in April 2020, the beginning of the current economic expansion. I argued that despite a strong economy both nationally and in the Eighth Federal Reserve District,Headquartered in St. Louis, the Eighth Federal Reserve District covers all of Arkansas, most of Missouri, and parts of Illinois, Indiana, Kentucky, Mississippi and Tennessee. this could be attributed to growing economic anxiety or uncertainty, attributable in part to inflation having outpaced wage growth and some consumers needing to resort to credit to meet expenses. Lower- and moderate-income households may face further barriers affecting their financial well-being.
This blog post will focus on the role of labor market outcomes in influencing current economic sentiment, with the following characteristics of the two most recent U.S. economic expansions serving as key potential contributors.I counted the beginning of an expansion from the same month or quarter as a trough in economic activity as defined by the National Bureau of Economic Research.
The Current Economic Expansion (April 2020 to Present)
- Labor share, the portion of national income allocated to wages, has fallen.
- Real hourly compensation grew more slowly than did worker productivity from the second quarter of 2020 to the first quarter of 2025.
- Real hourly compensation did not begin to consistently increase until the 12th quarter of the expansion (the first quarter of 2023).
- In 2022, 42% of U.S. households were considered asset-limited and income-constrained but employed, or ALICE. This means they held jobs and had incomes above the federal poverty line but still did not have enough resources to cover the cost of basic items in a survival budget.
The June 2009 to February 2020 Economic Expansion
- The share of ALICE households was roughly the same in 2010 as it was in 2022.
- During the second half of this period, the ALICE Essentials Index—which measures changes in the cost of the basics that matter most to ALICE households—increased 14.5%, compared with 8% for the consumer price index (CPI).The ALICE Essentials Index measures changes over time in the prices of the essentials that make up a large portion of ALICE and poverty-level households’ expenditures: housing, child care, food, transportation, health care and basic technology. The Bureau of Labor Statistics’ CPI tracks a much larger basket of more than 200 categories of goods and services.
- Overall, labor share trended slightly downward during the economic expansion.
- The wage growth of full-time workers across the wage distribution did not exceed CPI growth until the 31st quarter of the expansion (the fourth quarter of 2016).
Asset Limited, Income Constrained, Employed
The ALICE concept refers to the percentage of households in a community that are unable to fund a survival budget. A survival budget represents the bare-minimum cost of certain household basics (housing, child care, food, transportation, health care and a smartphone plan, plus taxes and a small contingency). The estimate is calculated at the county level for a variety of household types (e.g., number of children). The members of many ALICE households:
- Earn wages that do not keep pace with increases in the cost of living
- Work multiple jobs but still cannot pay their bills
- Provide care and assistance to family members, making it harder to find employment and remain employed
- Are forced to make difficult choices between paying for housing, food, medical care, child care, transportation or utilities
The first ALICE estimates were published in 2010. At that time, the share of ALICE households ranged from 41% to 43%. The share of ALICE households was a similar 41% in 2019 and 42% in 2022, the most recent estimate. Five of the seven states that make up the Fed’s Eighth District had ALICE estimates that equaled or exceeded the 2022 national average of 42% (Arkansas, 47%; Kentucky, 45%; Mississippi, 52%; Missouri, 42%; and Tennessee, 44%). Two Eighth District states, Illinois and Indiana, had ALICE estimates below the U.S. average, at 37% and 40%, respectively. In other words, a large share of U.S. and Eighth District households experience financial stress.
Rising prices are not a recent challenge for ALICE households. Before the pandemic and recent bout of inflation, many such households faced rising housing, health care and child care costs. For example, during the second half of the June 2009 to February 2020 expansion, the ALICE Essentials Index increased more than the CPI, meaning inflation disproportionately affected the items that ALICE households buy.
Labor Share, Real Hourly Compensation and Worker Productivity
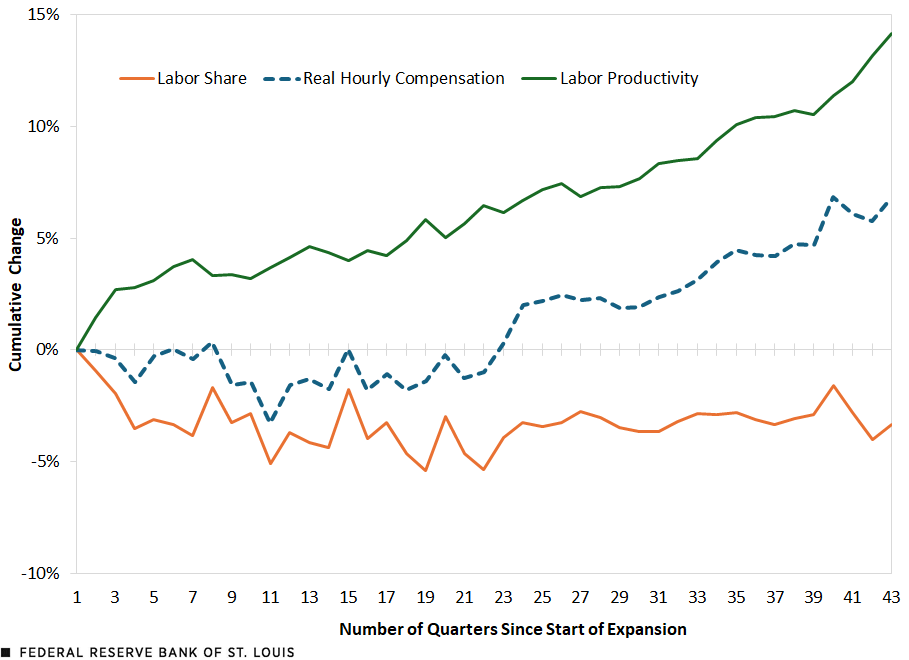
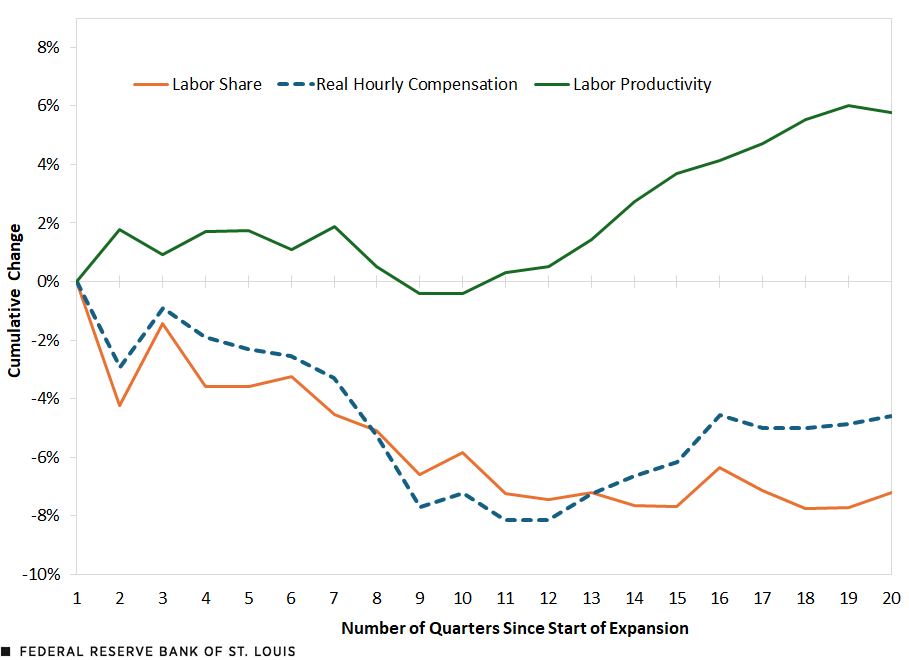
Labor share is the portion of national income that goes to workers’ wages (i.e., total labor compensation relative to gross domestic product). A historical view reveals that since the U.S. Bureau of Labor Statistics began reporting an index of labor share in 1947, the first quarter 2025 estimate was one of the lowest at 97.7.See data from the U.S. Bureau of Labor Statistics on labor share for all workers in the nonfarm business sector, retrieved via FRED. In the June 2009 to February 2020 expansion, labor share remained largely unchanged. During the current expansion, it trended downward for the first 13 to 14 quarters and has shown little improvement since. (See the figures below.)
Change in Labor Share, Real Hourly Compensation and Labor Productivity, June 2009 to February 2020 Expansion (2009:Q2-2019:Q4)
Change in Labor Share, Real Hourly Compensation and Labor Productivity, Current Expansion (2020:Q2-Present)
SOURCES FOR THE TWO FIGURES: Bureau of Labor Statistics and author’s calculations.
NOTES FOR THE TWO FIGURES: Figure data are quarterly. Measured quarterly by the National Bureau of Economic Research, the June 2009 to February 2020 expansion lasted from the second quarter of 2009 to the fourth quarter of 2019 and the current expansion began in the second quarter of 2020. Current expansion data are through the first quarter of 2025.
Worker productivity indicates how efficiently individuals produce goods and services (i.e., the amount of output created per work hour). Typically, higher productivity growth is associated with greater compensation. The figures above also compare real hourly compensation and productivity growth in the two expansions. A gap between productivity growth and real hourly compensation emerged in the June 2009 to February 2020 expansion. Real hourly wages increased, but not before stagnating for the first 22 quarters of the expansion. During the current expansion, which began in April 2020, it took 12 quarters for real hourly compensation to start consistently increasing. These increases have been modest, and they have not closed the gap with productivity growth.
Hourly Earnings, Usual Weekly Wages and Price Growth
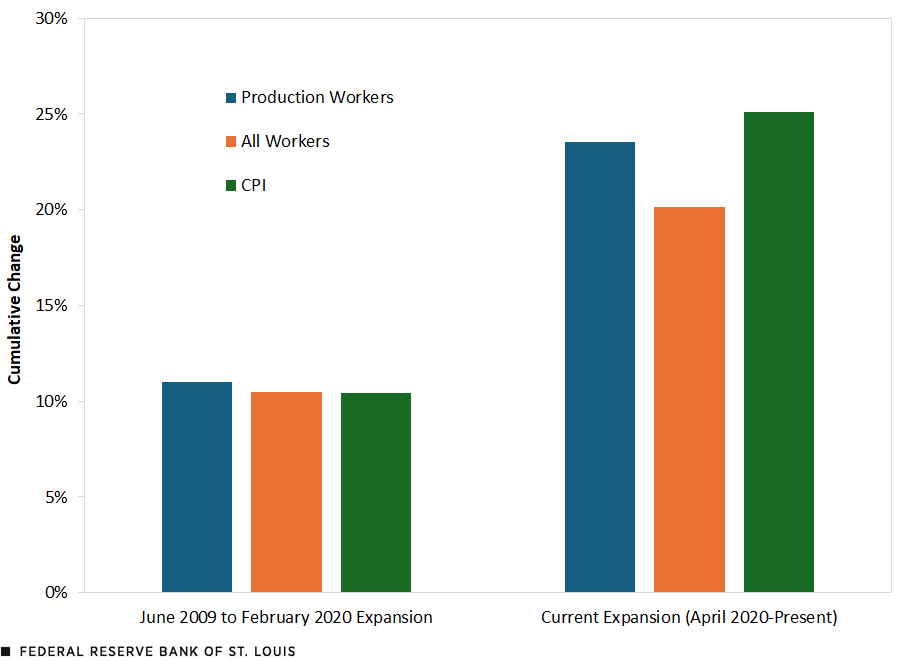
This section examines wage and price growth during the June 2009 to February 2020 and current expansions. The next figure, which reports cumulative growth in nominal hourly earnings at 61 months into each economic expansion (June 2014 and April 2025), shows that earnings growth barely kept pace with CPI inflation during the June 2009 to February 2020 expansion. During the current expansion, hourly earnings have not kept up with the CPI, which has grown faster than earnings for production and nonmanagerial workersProduction and related employees in manufacturing and in mining and logging, construction employees in construction, and nonsupervisory employees in private service-providing industries collectively are known as production and nonsupervisory employees. and for all workers.
Change in Hourly Earnings and CPI at 61 Months into the June 2009 to February 2020 and Current Expansions
SOURCES: Bureau of Labor Statistics and author’s calculations.
NOTES: Production and related employees in manufacturing and in mining and logging, construction employees in construction, and nonsupervisory employees in private service-providing industries collectively are production and nonsupervisory employees. The current expansion began in April 2020.
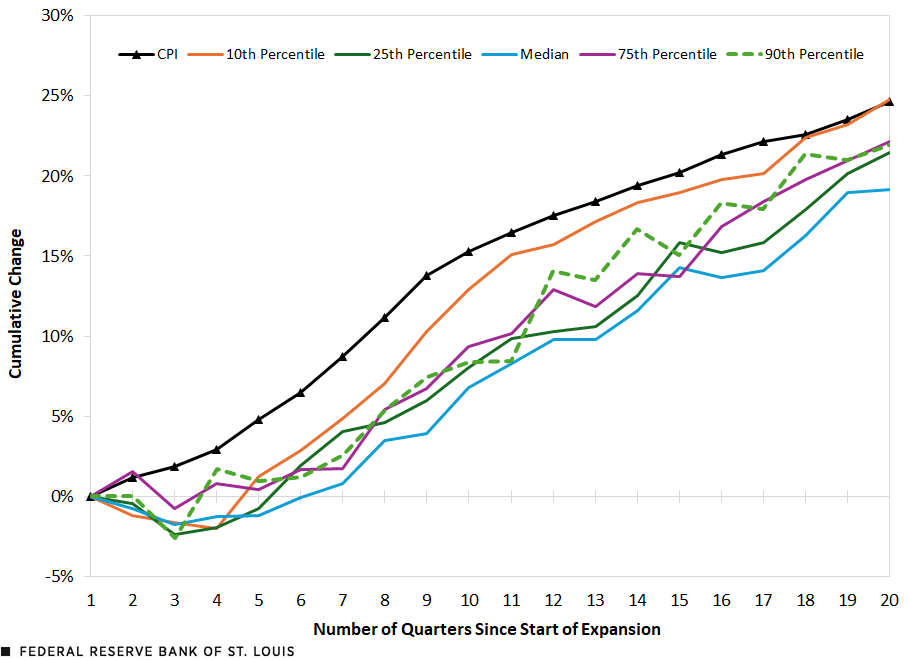
Full-time usual weekly wages tell a similar story. These data make it possible to describe wage growth at different segments of the wage distribution—in this case the 10th, 25th, median, 75th and 90th percentiles. One interpretation of the wage distribution is that each percentile represents a skill level. For example, the 10th (lowest wage) percentile might represent low-skilled workers. The following figure shows that, during the expansion starting in April 2020, growth in full-time usual weekly wages lagged the CPI at each segment of the distribution. Wage growth at the 10th and 90th (highest wage) percentiles began catching up to CPI inflation in the expansion’s 11th and 12th quarters, but they did not converge with it, or come close to converging, until the 18th quarter of the expansion (the third quarter of 2024). Wage growth at the 25th, median and 75th percentiles lagged the CPI for the full 20 quarters.
Growth in Usual Weekly Wages and CPI, Current Expansion (2020:Q2-Present)
SOURCES: Bureau of Labor Statistics and author’s calculations.
NOTES: Figure data are quarterly. Measured quarterly by the National Bureau of Economic Research, the April 2020 expansion began in the second quarter of 2020. Current expansion data are through the first quarter of 2025.
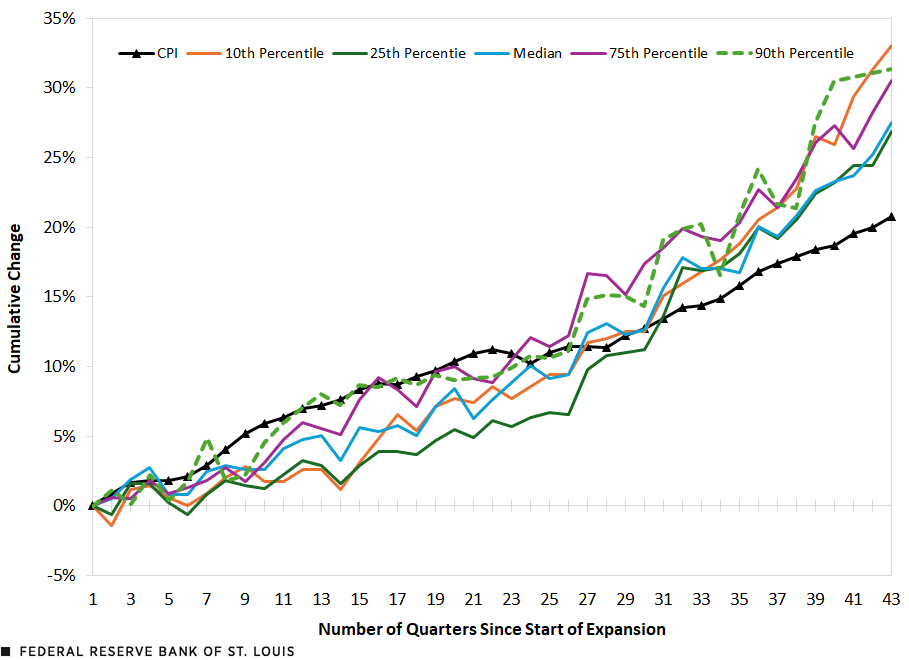
During the June 2009 to February 2020 expansion, full-time usual weekly wages exhibited a different pattern. Wage growth at the 90th (highest wage) percentile mirrored CPI growth for much of the expansion’s first half, then started exceeding it in the 26th quarter. However, wage growth at the 10th (lowest wage) percentile and median didn’t consistently surpass the CPI until the 30th quarter of the expansion (the third quarter of 2016).
Growth in Usual Weekly Wages and CPI, June 2009 to February 2020 Expansion (2009:Q2-2019:Q4)
SOURCES: Bureau of Labor Statistics and author’s calculations.
NOTES: Figure data are quarterly. Measured quarterly by the National Bureau of Economic Research, the June 2009 to February 2020 expansion lasted from the second quarter of 2009 to the fourth quarter of 2019.
Why was wage growth so strong at the 10th (lowest wage) percentile? One hypothesis is that a “tight” labor market put greater upward pressure on pay at the lower end of the wage distribution. Another hypothesis involves the increase of state minimum wages. During these two periods of economic expansion, minimum wages exceeded the federal minimum wage of $7.25 per hour in more than 30 states. Nevertheless, these results demonstrate an economic expansion does not necessarily guarantee real wage growth.
Summary and Conclusions
A variety of indicators demonstrates the labor market’s contribution to existing U.S. economic sentiment, which seems to suggest a fair level of anxiety since the COVID-19 pandemic. Further, conditions during the June 2009 to February 2020 economic expansion matter. For example, due to the nature of their purchasing needs, ALICE households in particular faced greater inflation, as well as diminishing purchasing power.
The erosion in labor share, the gap between wages and productivity, and stagnating real wages may mean that low- and moderate-income households must find ways to make up the difference between their after-tax income and their expenses. The evidence presented in this blog post and my earlier one suggests a weakening in the ability of economic growth to lift all boats.
Notes
- The Index of Consumer Sentiment, which is derived from the University of Michigan’s Surveys of Consumers, is also published for three income categories: the bottom 33%, the middle 33% and the top 33%. My statement about sentiment levels holds for each income category. In May 2025, the indexes for each income category were 32, 37 and 33 points, respectively, below their values in April 2020, the beginning of the current economic expansion.
- Headquartered in St. Louis, the Eighth Federal Reserve District covers all of Arkansas, most of Missouri, and parts of Illinois, Indiana, Kentucky, Mississippi and Tennessee.
- I counted the beginning of an expansion from the same month or quarter as a trough in economic activity as defined by the National Bureau of Economic Research.
- The ALICE Essentials Index measures changes over time in the prices of the essentials that make up a large portion of ALICE and poverty-level households’ expenditures: housing, child care, food, transportation, health care and basic technology. The Bureau of Labor Statistics’ CPI tracks a much larger basket of more than 200 categories of goods and services.
- See data from the U.S. Bureau of Labor Statistics on labor share for all workers in the nonfarm business sector, retrieved via FRED.
- Production and related employees in manufacturing and in mining and logging, construction employees in construction, and nonsupervisory employees in private service-providing industries collectively are known as production and nonsupervisory employees.

Citation
William M. Rodgers III, ldquoEconomic Sentiment and the Role of the Labor Market,rdquo St. Louis Fed On the Economy, June 26, 2025.
This blog offers commentary, analysis and data from our economists and experts. Views expressed are not necessarily those of the St. Louis Fed or Federal Reserve System.
Email Us
All other blog-related questions