


Economic Sentiment and Indicators of Household Financial Wellness
Despite strong labor markets nationally and in the Eighth Federal Reserve District,Headquartered in St. Louis, the Eighth District covers all of Arkansas, most of Missouri, and parts of Illinois, Indiana, Kentucky, Mississippi and Tennessee. consumer sentiment has remained below levels prior to the COVID-19 pandemic and is at the lower range of its historical variation since the early 1950s, when estimates were first reported.The Index of Consumer Sentiment, derived from the University of Michigan’s Surveys of Consumers, was at 57.0 in March 2025. It was in the 51.7 to 112.0 range before the pandemic and has risen as high as 88.3 and fallen as low as 50.0 since April 2020. Another popular measure of consumer sentiment is the Consumer Confidence Index. One way to think about consumer sentiment could be as the degree of anxiety or uncertainty among Americans about their economic futures.
Lower consumer sentiment since the pandemic’s onset may seem surprising, given strong job growth over the last few years. Since the start of the current economic expansion in April 2020, nonfarm payroll grew by 29.1 million (22.3%), well above the growth during the three previous expansions.I counted the beginning of an expansion from the same month or quarter as a trough in economic activity as defined by the National Bureau of Economic Research. Job growth in the U.S. during the three previous expansions was as follows: 21.3 million (16.2%) from June 2009 to February 2020, 7.3 million (5.5%) from November 2001 to December 2007 and 24.2 million (22.3%) from March 1991 to March 2001. The larger job growth in the current expansion is partially due to the V-shaped economic recovery from the COVID-19 pandemic. Nationally, almost 22 million jobs were lost from February 2020 to April 2020, but 10.4 million jobs were added between the second month (May 2020) and the fifth month (August 2020) of the expansion. In Eighth District states, through March 2025, or through 60 months of the expansion, 3.3 million (19.1%) total nonfarm jobs were added. During the June 2009 to February 2020 expansion, in Eighth District states, 2.1 million (11.6%) jobs were added. During the November 2001 to December 2007 expansion, 572,000 (3.1%) jobs were created. During the March 1991 to March 2001 expansion, a total of 3.0 million (19.5%) jobs were added. A total of 2.6 million Eighth District jobs were lost from February 2020 to April 2020, with 1.4 million jobs gained from May 2020 to August 2020. However, using sentiment as a gauge, consumers appear to remain concerned about their economic outlook.
Inflation Levels
Elevated levels of inflation since March 2021, which affected the financial well-being of households in the Eighth District and across the U.S.,The 2024 Survey of Household Economics and Decisionmaking found that lower-income adults were more likely to experience material hardships, including not paying all bills, not always having enough to eat and skipping medical care because of cost. may be one explanation for this economic anxiety.
The figure below shows that year-over-year growth in the headline personal consumption expenditures (PCE) price index and headline consumer price index (CPI) peaked in June 2022 at 7.2% and 9.0%, respectively. During the first few months of 2025, overall price growth declined to nearer the Fed’s 2% target. PCE inflation and CPI inflation were 2.3% and 2.4%, respectively, in March 2025. However, CPI data since January 2025 showed a tick upward in prices for several key household items. For the 12 months ending April, the index for meats, poultry, fish and eggs rose 7.0%, with eggs increasing 49.3% due to the bird flu’s impact on supply.
PCE and CPI Inflation in the U.S., January 2009-March 2025
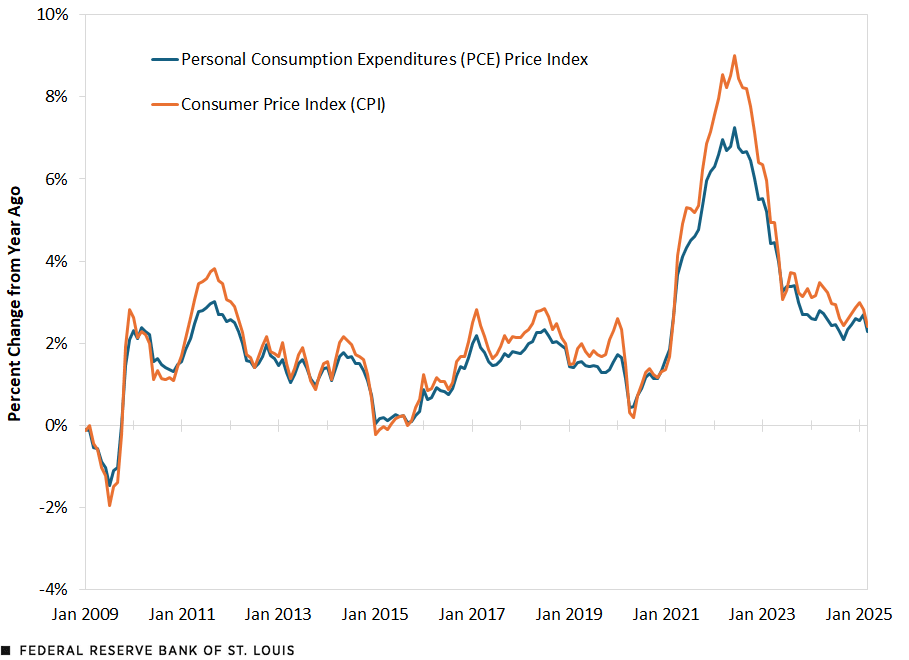
SOURCE: Bureau of Labor Statistics via FRED®.
Household Income
Such price growth naturally raises questions about the extent to which household income has been able to keep up. Data suggest slightly different patterns have emerged at the national and Eighth District levels.
The following figure measures the percentage point change in real mean income for U.S. households by quintile and for the top 5% of all U.S. households from 2009 to 2023, a period spanning two economic expansions (June 2009 to February 2020 and April 2020 to present) and the COVID-19 recession between them. The figure reports the percentage point change at three intervals: 2009-14, 2014-19 and 2019-23. Between 2009 and 2014, real household income fell for the fifth (lowest income) and fourth (second lowest income) quintiles. Real household income stagnated between these two years for the third quintile. Between 2014 and 2019, income grew faster than inflation did across the distribution. The present challenge facing households appears between 2019 and 2023. Real household income declined across the distribution. The largest decline was in the fifth (lowest income) quintile, the bottom of the income distribution.
Change in Real Mean Income among U.S. Households, 2009-23
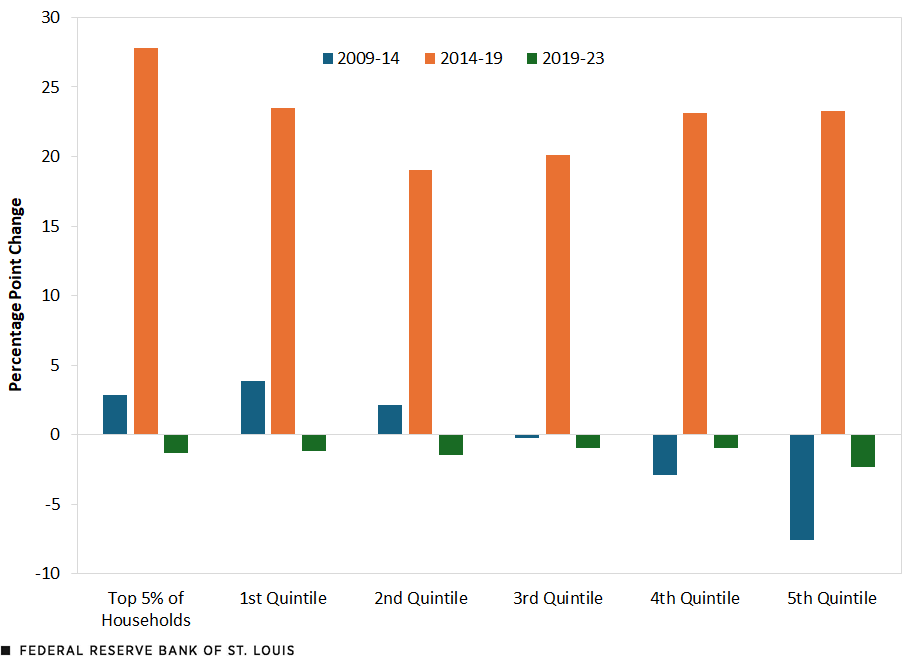
SOURCES: U.S. Census Bureau (Current Population Survey, 2009-23 Annual Social and Economic Supplements) and author’s calculations.
NOTE: The first quintile is the highest-income group, and the fifth quintile is the lowest-income group.
Real household income for the median, or typical, Eighth District state fell more than the U.S. median real household income from 2009 to 2014. (See the figure below.) During the period from 2014 to 2019, the household income of the median Eighth District state adjusted for inflation rose by 18.7%, compared with the 20.6% increase of the U.S. median household income. However, the Eighth District did better than the nation overall from 2019 to 2023. U.S. median real household income fell by 0.7%, while the median among the Eighth District states increased by 8.6%. It is important to note that 2023 median real household income of Eighth District states was 90% of the U.S. median real household income, up from 82% in 2019.
Median Real Household Income for the U.S. and of Eighth District States, 1984-2023
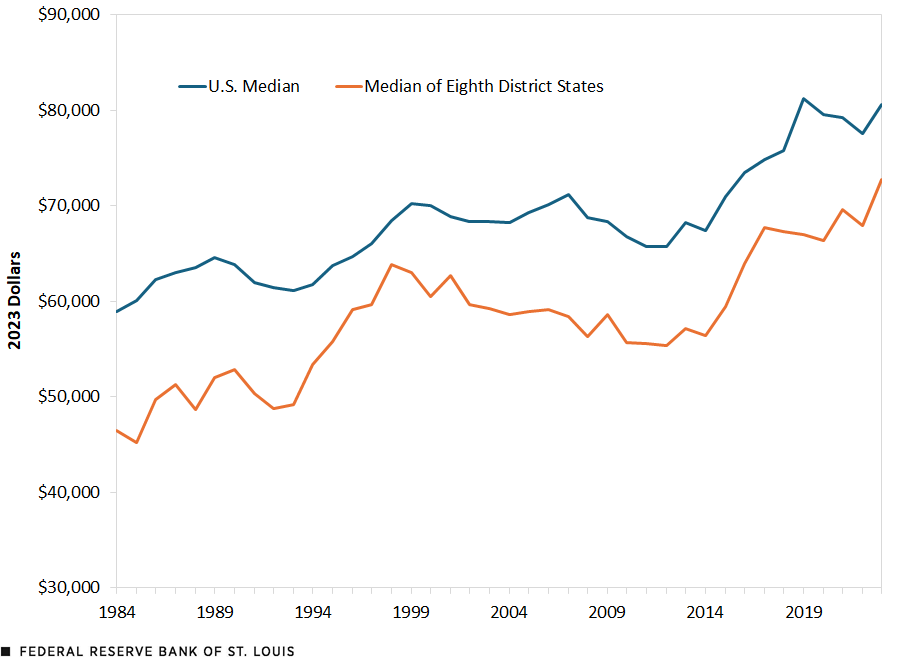
SOURCE: U.S. Census Bureau via FRED®.
The next figure reports U.S. households’ after-tax monthly surplus income by decile for 2014 to 2023.After-tax monthly surplus income equals average annual after-tax income (including transfer benefits) minus average annual household expenditures. From 1984 to 2023, the Bureau of Labor Statistics published this data by quintiles. Starting in 2014, it began publishing this data by deciles, giving more detail to the distribution. Estimates using the earlier data still suggest that just over 50% of households had little to no discretionary income. The data are from the Bureau of Labor Statistics’ Consumer Expenditure Survey. The key takeaway from the figure is that except for 2020 and 2021 (years in which pandemic relief was at its highest), half of households had no discretionary income. At the fifth decile, again except for 2020 and 2021, households had small surpluses. In other words, many must borrow or find other resources to pay their bills and make ends meet. For example, in 2023, households in the 10th (lowest surplus) decile needed to borrow $1,903 monthly to make ends meet. This was up from $1,387 in 2014. Households in the fifth decile had small monthly surpluses that were $343 and $375 in 2022 and 2023, respectively. These households may be a job loss, illness or natural disaster away from having to incur debt or tap some other type of assistance.
After-Tax Monthly Surplus Income by Decile, 2014-23
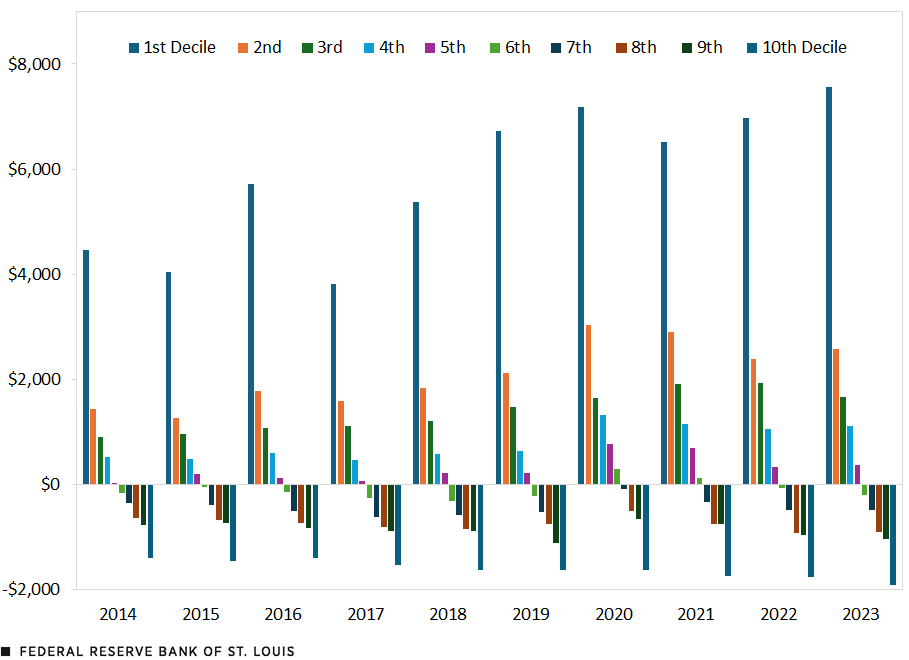
SOURCES: Bureau of Labor Statistics and author’s calculations.
NOTES: After-tax monthly surplus equals average annual after-tax income minus average annual expenditures. The estimate is divided by 12 to obtain monthly values. Values are in nominal terms. The first decile is the highest-surplus group, and the 10th decile is the lowest-surplus group.
Consumer Debt
Given higher prices and household incomes that have lagged inflation, how might U.S. consumers address financial shortfalls? Taking on debt is one approach. However, households with greater debt are more constrained in their ability to consume and invest because they must use their incomes to repay the debt’s interest and principal.
Compared with the 20th quarter of the economic expansion of June 2009 to February 2020 (that is, the first quarter of 2014), households were worse off—with respect to debt—20 quarters into the current economic expansion (the first quarter of 2025). In the June 2009 to February 2020 expansion, total household debt was a cumulative 6.1% lower at 20 quarters (the second quarter of 2009 to the first quarter of 2014), and credit card debt was down 20%. Student loan debt, however, was up 64.5% over this period, rising from 5.4% of total household debt to 9.5%.
Looking at the current economic expansion, which began in April 2020, the cumulative increase in total household debt at 20 quarters (the second quarter of 2020 to the first quarter of 2025) was 27.6%, with the fastest-growing component being credit card debt. Credit card debt increased by 44.7% over the period, but its share of total debt remained within a range of 5.3% to 6.7% during those 20 quarters. Student loans’ share of total debt fell from 10.8% to 9%.
Growth in loan delinquency may better capture households’ financial stress. The table below reports the cumulative percentage point change in delinquent household debt at the 20th quarter of the previous and current expansions (again, the first quarter of 2014 and first quarter of 2025, respectively) by type of debt and level of severity. Although delinquency for all household debt has increased across severities during the current expansion, those increases have been modest. Disaggregating the data by loan type, however, paints a quite different picture. Student loans and credit card debt stand out, particularly in terms of newly delinquent loans. New delinquent student loans rose 1.56 percentage points; new delinquent credit card debt grew 2.55 percentage points. New seriously delinquent student loans and credit card debt also increased.
| Current Expansion | All | Mortgage | HELOC | Auto | Credit Card | Student Loans | Other |
|---|---|---|---|---|---|---|---|
| Percent of Balance Seriously Delinquent (90 Days or More) | 0.23 | 0.02 | -0.38 | -0.04 | 2.56 | 0.77 | 1.74 |
| New Delinquent (30 Days or More) Balances | 0.88 | 0.61 | 0.26 | 1.70 | 2.55 | 1.56 | 1.08 |
| New Seriously Delinquent (90 Days or More) Balances | 0.40 | 0.14 | 0.10 | 0.68 | 1.99 | 1.56 | 0.85 |
| 2009:Q2 Expansion | All | Mortgage | HELOC | Auto | Credit Card | Student Loans | Other |
| Percent of Balance Seriously Delinquent (90 Days or More) | -3.03 | -4.21 | -0.60 | -1.15 | -3.23 | 2.75 | -0.08 |
| New Delinquent (30 Days or More) Balances | -6.31 | -7.48 | -4.01 | -3.99 | -7.84 | 1.68 | -5.71 |
| New Seriously Delinquent (90 Days or More) Balances | -4.82 | -5.93 | -3.25 | -1.92 | -6.33 | 2.60 | -4.26 |
| SOURCES: Federal Reserve Bank of New York Household Debt and Credit Report (2025:Q1) and author’s calculations. | |||||||
| NOTE: The first quarter of 2025 was 20 quarters into the current expansion and the first quarter of 2014 was 20 quarters into the 2009:Q2 expansion. | |||||||
Student loan delinquency also increased during the previous expansion, potentially weakening household balance sheets before the current expansion. During the current expansion, delinquent debt in the “other” category—which includes sales financing and personal, clothing, grocery, department store, home furnishing and gas loans—ticked up across severities by roughly 1 to 2 percentage points.
Summary and Conclusions
A key point is that lower consumer sentiment—or economic anxiety, if you will—since the COVID-19 pandemic likely cannot be attributed solely to current economic conditions. In 2023, more than half of U.S. households had little or no discretionary income. This level has remained virtually unchanged since the mid-1980s (as far back as published data exist), meaning that for decades low- and moderate-income households have had to find ways to fill the gap between their after-tax income and expenses. A persistent lack of discretionary income likely diminished the economic resiliency of this large share of households and exacerbated the impact of recent inflation. To make ends meet, many U.S. households increased their debt during the current economic expansion, with delinquency rates rising.
My next blog post will examine how declining labor share, a growing gap between productivity growth and wage growth, and falling inflation-adjusted wages may be contributing to the sense of economic anxiety suggested by lower consumer sentiment.
Notes
- Headquartered in St. Louis, the Eighth District covers all of Arkansas, most of Missouri, and parts of Illinois, Indiana, Kentucky, Mississippi and Tennessee.
- The Index of Consumer Sentiment, derived from the University of Michigan’s Surveys of Consumers, was at 57.0 in March 2025. It was in the 51.7 to 112.0 range before the pandemic and has risen as high as 88.3 and fallen as low as 50.0 since April 2020. Another popular measure of consumer sentiment is the Consumer Confidence Index.
- I counted the beginning of an expansion from the same month or quarter as a trough in economic activity as defined by the National Bureau of Economic Research. Job growth in the U.S. during the three previous expansions was as follows: 21.3 million (16.2%) from June 2009 to February 2020, 7.3 million (5.5%) from November 2001 to December 2007 and 24.2 million (22.3%) from March 1991 to March 2001. The larger job growth in the current expansion is partially due to the V-shaped economic recovery from the COVID-19 pandemic. Nationally, almost 22 million jobs were lost from February 2020 to April 2020, but 10.4 million jobs were added between the second month (May 2020) and the fifth month (August 2020) of the expansion. In Eighth District states, through March 2025, or through 60 months of the expansion, 3.3 million (19.1%) total nonfarm jobs were added. During the June 2009 to February 2020 expansion, in Eighth District states, 2.1 million (11.6%) jobs were added. During the November 2001 to December 2007 expansion, 572,000 (3.1%) jobs were created. During the March 1991 to March 2001 expansion, a total of 3.0 million (19.5%) jobs were added. A total of 2.6 million Eighth District jobs were lost from February 2020 to April 2020, with 1.4 million jobs gained from May 2020 to August 2020.
- The 2024 Survey of Household Economics and Decisionmaking found that lower-income adults were more likely to experience material hardships, including not paying all bills, not always having enough to eat and skipping medical care because of cost.
- After-tax monthly surplus income equals average annual after-tax income (including transfer benefits) minus average annual household expenditures. From 1984 to 2023, the Bureau of Labor Statistics published this data by quintiles. Starting in 2014, it began publishing this data by deciles, giving more detail to the distribution. Estimates using the earlier data still suggest that just over 50% of households had little to no discretionary income.

Citation
William M. Rodgers III, ldquoEconomic Sentiment and Indicators of Household Financial Wellness,rdquo St. Louis Fed On the Economy, June 5, 2025.
This blog offers commentary, analysis and data from our economists and experts. Views expressed are not necessarily those of the St. Louis Fed or Federal Reserve System.
Email Us
All other blog-related questions