


Banking Analytics: The Growing Connection between Bank and Nonbank Sectors
In the first quarter of 2025, U.S. banks held $1.14 trillion in loans outstanding to the nonbank financial sector. This sector consists of nondepository financial institutions (NDFIs), which engage in credit intermediation, asset management, market-making and other financial services in the economy. This interconnectedness between banks and nonbanks adds an extra layer of intermediation, as banks lend to mortgage companies, insurance companies, investment funds (such as mutual funds, money market funds, hedge funds and private capital funds), pension funds, broker-dealers, securitization vehicles and other financial entities, which then lend directly to end users in the economy.
The NDFI share of bank loan portfolios has grown significantly. The annualized growth rate in NDFI lending has averaged approximately 26% per year since 2012. Undoubtedly, NDFI lending has experienced the fastest growth rate among all forms of bank lending, especially as of late—expanding 9.3% in the first quarter of 2025 after growing by 7.4% on average for each quarter of 2024—as other loan types have seen modest levels of growth. (All statistics in this post use only domestic call report data.)
Bank lending to NDFIs is well diversified in terms of the type of intermediary: Loans to mortgage and private credit intermediaries each represent 23% of loans outstanding, and loans to business intermediaries and consumer intermediaries represent 21% and 9%, respectively. Other loans, which represent 24%, include loans to bank holding companies, insurance companies, pension funds, investment banks and broker-dealers, and federally sponsored lending agencies, among many others. (See the figure below.)
U.S. Bank Loans to Nondepository Financial Institutions, by Type of Intermediary
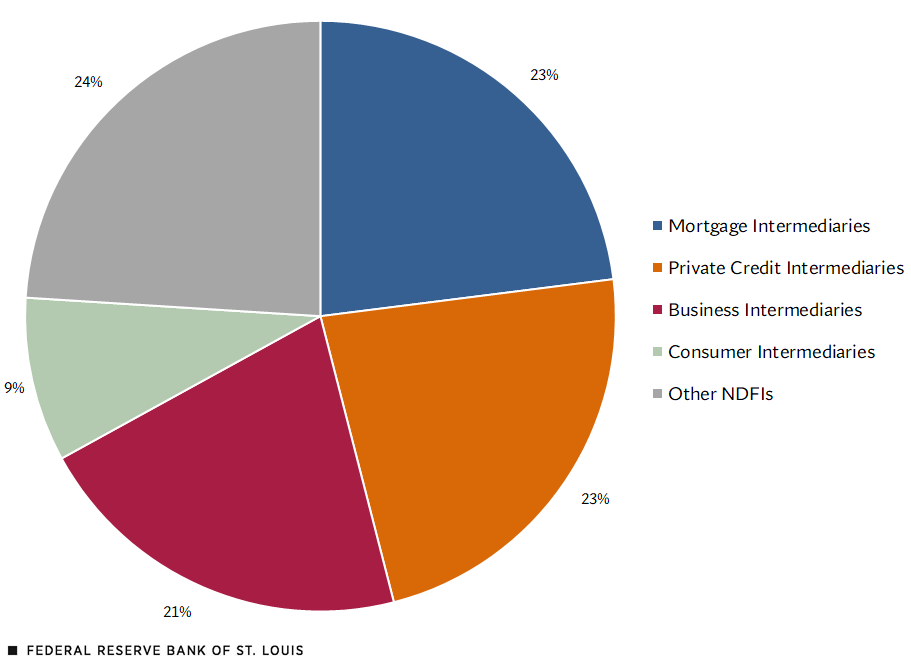
SOURCE: Schedule RC-C (Loans and Lease Financing Receivables) (PDF) from the Consolidated Reports of Condition and Income (Call Report).
NOTES: Data as of March 31, 2025. Percentages are calculated using only domestic call report data.
Banks provide liquidity to NDFIs, particularly in the form of lines of credit to special purpose vehicles, finance companies and direct lenders. This liquidity is channeled through many different financial conduits, depending on the type of intermediary, as illustrated in the figure above. For example, real estate investment trusts are special purpose vehicles for mortgage intermediaries; business development companies and small-business investment companies are used by business intermediaries; collateralized debt obligations, collateralized loan obligations, and private debt funds are used by private credit; and asset-backed commercial paper conduits are used by consumer intermediaries, among others.


Citation
Amalia Estenssoro and Reed Romanko, ldquoBanking Analytics: The Growing Connection between Bank and Nonbank Sectors,rdquo St. Louis Fed On the Economy, June 30, 2025.
This blog offers commentary, analysis and data from our economists and experts. Views expressed are not necessarily those of the St. Louis Fed or Federal Reserve System.
Email Us
All other blog-related questions