


U.S. Retirement Normalization following the COVID-19 Pandemic
As one of the largest shocks ever experienced by the U.S. economy, the COVID-19 pandemic and its aftermath were marked by historic fluctuations in macroeconomic and financial variables. These large fluctuations triggered a series of abnormal phenomena, such as a substantial increase in the share of people who were retired.
As noted in a 2021 Economic Synopses essay, the number of retirees, according to the Current Population Survey (CPS), greatly increased during the pandemic, contributing to a decline in the labor force participation rate—the percentage of the civilian noninstitutional population age 16 and older that is employed or actively looking for work. The essay estimated that as of August 2021, more than 2.4 million people had likely retired in excess of the prepandemic trend.
Several factors may have contributed to this. For one, the health risks posed by COVID-19 may have incentivized older individuals to retire earlier than they would have intended so as to avoid catching the virus, given that they were at greater risk of death or serious illness than the rest of the population. A 2023 On the Economy blog post investigated the effect that rising asset prices had on retirements: Returns on asset classes such as housing and stocks were high by historical standards, which may have induced certain people to work less, particularly those close to retirement. Other factors that may have contributed to an increase in retirements included poor labor market conditions and increased transfer payments from the government.
In this blog post, we analyze recent trends in the aggregate retirement share along with recent research that aims to shed light into the potential causes of the “Great Retirement Boom.”
The Great Retirement Boom
We use data from the CPS to estimate the retired population. This survey is a monthly household survey administered by the Census Bureau and the Bureau of Labor Statistics, containing person-level data on demographics and working hours. In particular, the CPS measures a respondent’s labor force status, which can be “retired.”
Using CPS data, the first figure shows the share of the population that is retired. The linear trend line—fitted on the data from June 2008 to February 2020—is designed to represent the retirement share based on demographic trends, in the absence of economic fluctuations and other factors that could affect people’s decisions to retire or not (such as a public health emergency like COVID-19). The trend is estimated starting in 2008—the first year in which the oldest baby boomers turned 62 and thus became eligible to collect Social Security benefits—and ending in February 2020, which is the final full month before the outbreak of the COVID-19 pandemic in the U.S.
Retirement Share: Reality vs. Trend
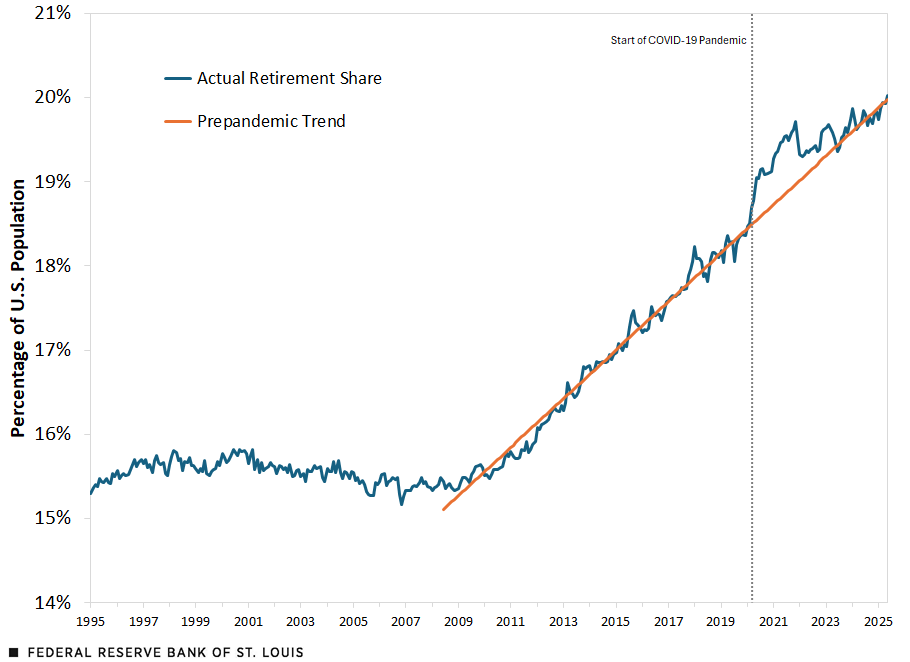
SOURCES: Current Population Survey and authors’ calculations.
The retirement share increased at a roughly linear rate between 2008 and 2020, reflecting the baby boomer generation reaching retirement age. Pre-2020, the retirement share closely follows the trend line, orbiting above or below the linear trend within narrow bounds. While there were fluctuations in the prepandemic retirement share, these tended to be short run in duration and small in magnitude. The pandemic caused a massive disruption; in 2020, the share of retirements spiked far above the trend line and remained elevated for several years. At its peak, the difference between the actual retirement share and its trend was close to 1% of the U.S. civilian population.
Return to Normalcy
As the public health and economic effects of the pandemic subsided, the retirement share reverted to its prepandemic trend. After the initial spike in retirements, the data show a normalization of retirement patterns. The labor force participation rate began to recover, moving from 61.9% to 62.2% in 2022 as more workers rejoined the labor force.
The second figure shows excess retirements, defined as the share of additional retirements relative to the prepandemic trend line, measured in percentage points. Again, we see a large increase in retirements around COVID-19, particularly in the early years of the pandemic. However, in more recent years, the number of excess retirements has steadily declined toward the baseline trend. In fact, in late 2024 and early 2025, the share of excess retirements actually fell below zero, indicating that the retirement share had fallen below its long-term trajectory. This suggests a relatively swift return to more-normal retirement patterns as the factors driving the initial pandemic-era surge have faded in importance.
Excess Retirements
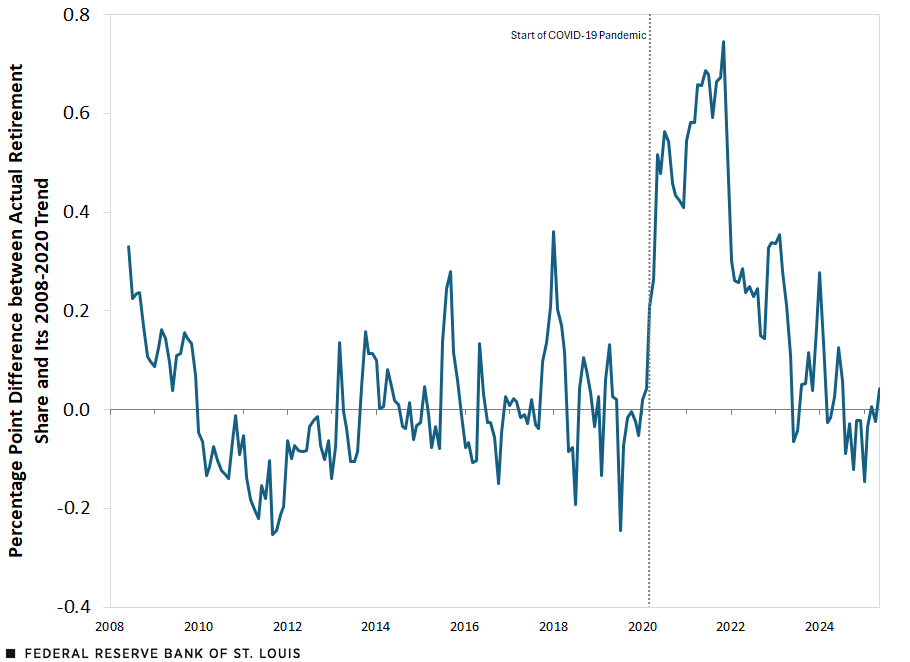
SOURCES: Current Population Survey and authors’ calculations.
Studying the Rise and Fall of Excess Retirements
In the introduction, we discussed some of the potential economic reasons that may have contributed to the rise in the retirement share during the pandemic, besides public and private health concerns. Chief among these are increases in net worth attributable to elevated asset returns, deteriorating labor market conditions and increased fiscal transfers, in the form of both economic impact payments and more generous unemployment insurance.
In a recent working paper (PDF), Serdar Birinci, Miguel Faria e Castro and Kurt See investigated and decomposed the causes of the rise and fall of the excess retirement share using a structural model.See “Dissecting the Great Retirement Boom,” Federal Reserve Bank of St. Louis Working Paper 2024-017C, revised March 2025. In the model, there are individuals of different ages, who make decisions regarding their spending and savings, and whether to work, be unemployed (i.e., look for a job), or leave the labor force altogether (which includes retirement). The model was designed and calibrated to replicate the state of the U.S. economy right before the pandemic. The three co-authors then simulated the 2020-23 period by hitting the economy with a series of shocks that proxy some of the disturbances experienced during the COVID-19 pandemic.
The advantage of using a structural model to study this type of topic is that it allows researchers to explore counterfactuals: They can turn off one disturbance at a time, and study how the evolution of the retired share would have been different in that case. For example, these researchers could study a scenario where labor markets still deteriorated and asset returns were elevated, but where the government did not increase fiscal transfers.
Birinci, Faria e Castro and See found, overall, that labor market conditions and government transfers explained the bulk of the increase in the excess retirement share. The reason is the following: In relative terms, they observed a larger increase in retirements for workers with lower incomes. These tended to be the workers who were more exposed to fluctuations in labor market conditions; that is, those who are more likely to lose their jobs during periods of rising unemployment. At the same time, these were the people whose labor market status was more sensitive to government transfers: They were more likely to receive unemployment compensation (because they were more likely to lose their jobs), and economic impact payments were a larger share of their income, and thus more likely to trigger a behavioral response. As labor markets recovered in the years following the pandemic and federal and state governments terminated many of their relief programs, the excess retirement share declined.
Conclusion
Overall, our analysis suggests that the Great Retirement Boom during the COVID-19 pandemic was driven primarily by deteriorating labor market conditions and more generous government transfer payments. As these factors normalized in the years following the pandemic, we have observed the retirement share revert to its prepandemic trend, highlighting the transitory nature of the initial surge in retirements.
Note
- See “Dissecting the Great Retirement Boom,” Federal Reserve Bank of St. Louis Working Paper 2024-017C, revised March 2025.


Citation
Miguel Faria-e-Castro, Serdar Birinci, Kurt See and Gus Gerlach, ldquoU.S. Retirement Normalization following the COVID-19 Pandemic,rdquo St. Louis Fed On the Economy, July 14, 2025.
This blog offers commentary, analysis and data from our economists and experts. Views expressed are not necessarily those of the St. Louis Fed or Federal Reserve System.
Email Us
All other blog-related questions