


Work More, Make Much More? The Relationship between Lifetime Hours Worked and Lifetime Earnings
Earnings inequality in the U.S. and around the globe is a major topic of research among economists. A key objective of this research is to isolate the quantitatively important forces that shape inequality. Two recent On the Economy blog posts focused on the role of job mobility and job risk. In this post, we consider a factor that has been largely neglected so far by the literature, namely differences among individuals in hours worked. In particular, we investigate the relationship between lifetime earnings inequality and lifetime hours worked. In line with many empirical studies, lifetime here refers to ages 25 to 55, a person’s prime working years.
Recent research has documented the distribution of lifetime earnings using administrative data (e.g., Social Security tax reports). However, analogous estimates for the distribution of lifetime hours worked have not yet been constructed because administrative data sources typically do not have information on these hours. Fortunately, one data source is capable of providing this information. In 1979, the U.S. Bureau of Labor Statistics’ National Longitudinal Survey of Youth began interviewing a group of individuals then ages 14 to 22 and has continued to interview them for over 40 years.
In this blog post, we focus on male workers, who were more likely to have uninterrupted employment histories than female workers during the period we are examining. We are able to construct a sample of 3,006 male workers for whom we have observations of earnings, weeks worked and weekly hours worked for each age from 25 to 55 (either via a direct report or via a simple imputation procedure for missing observations). Since we are interested in lifetime earnings, our sample already conditions on having worked in at least one year between 25 and 55.
We start by examining the distribution of lifetime hours worked and then analyze the relationship between lifetime hours worked and lifetime earnings.
Distribution of Lifetime Hours Worked
The table below shows the distribution of lifetime hours worked and its components. The second column shows that annualized lifetime hours worked (i.e., lifetime hours worked divided by 31, the number of years from ages 25 through 55) vary a lot across our sample of male workers. For example, someone at the 90th percentile of the lifetime hours distribution works on average almost 1,500 hours more each year from ages 25 to 55 than someone at the 10th percentile of the lifetime hours distribution (i.e., more than twice as many hours each year). Regarding the interquartile range, those at the 75th percentile work almost 600 (or 30%) more hours than those at the 25th percentile do.
| Percentile | Annualized Lifetime Hours Worked | Years Worked | Weeks per Year Worked | Hours per Week Worked |
|---|---|---|---|---|
| 5 | 952 | 19.4 | 40.8 | 38.7 |
| 10 | 1,276 | 24.5 | 39.8 | 41.8 |
| 25 | 1,885 | 29.9 | 47.1 | 41.4 |
| 50 | 2,168 | 29.9 | 50.6 | 44.7 |
| 75 | 2,450 | 30.5 | 49.9 | 50.1 |
| 90 | 2,766 | 30.9 | 51.0 | 54.4 |
| 95 | 2,983 | 31.0 | 51.6 | 57.7 |
| SOURCES: Bureau of Labor Statistics, National Longitudinal Survey of Youth (1979-2020) and authors’ calculations. | ||||
Lifetime hours worked are the product of the number of years worked, weeks per year worked and hours per week worked. The remainder of the table allows us to understand how these different margins vary across the lifetime hours distribution. The third column shows there is little variation in years worked from the 25th percentile onward, whereas below the 25th percentile, the number of years worked falls off sharply. The fourth column compares weeks worked per year. Similar to years worked, weeks worked display relatively little variation except at the bottom part of the distribution. The last column shows that, in contrast, hours per week worked increase steadily with lifetime hours worked. Hence, outside the bottom of the lifetime hours distribution, hours per week worked are the dominant source of heterogeneity in lifetime hours worked.
To illustrate this, we take the three components for the 25th percentile and then, one at a time, substitute the component’s value with the respective value for the 75th percentile. By doing this, we can see how much of the difference in lifetime hours worked between these two percentiles can be explained by the change in each component. Differences in years worked account for about one‑fifteenth of the difference in lifetime hours, differences in weeks worked per year for about one‑fifth, and differences in hours worked per week for about two‑thirds.
Lifetime Hours Worked and Lifetime Earnings
In our sample, variation in lifetime hours worked explains about 30% of the variation in lifetime earnings.This is the R2 in a regression of lifetime earnings on lifetime hours worked. In the figure below, we visualize this systematic relationship. In particular, we group individuals by their annualized lifetime hours worked (displayed on the horizontal axis). The solid blue line shows average lifetime earnings (again divided by 31) for each group, revealing that annualized lifetime earnings increase strongly with lifetime hours worked.
Lifetime Earnings and Lifetime Hours Worked: Mean Earnings for Male Workers
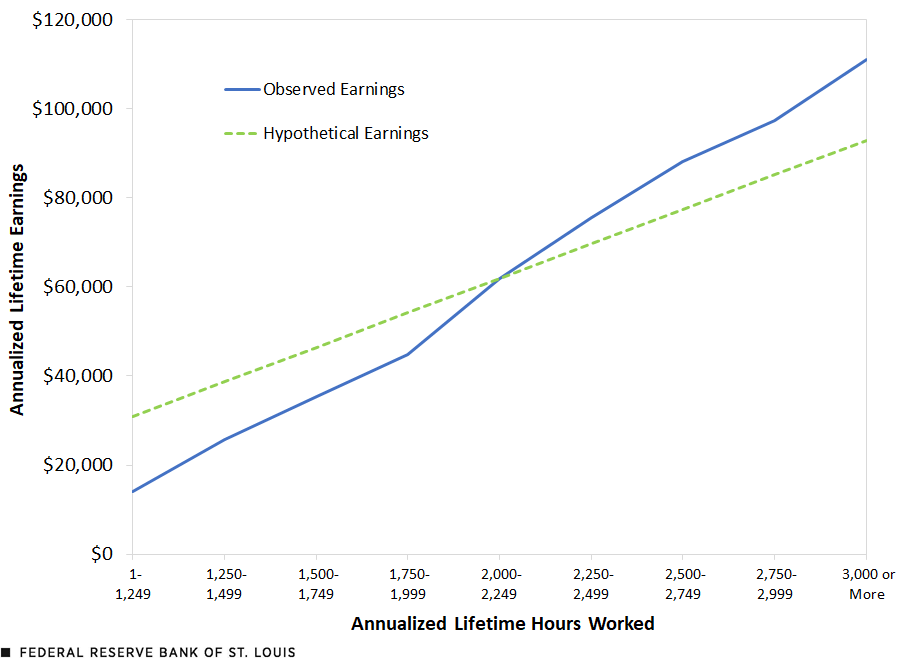
SOURCES: Bureau of Labor Statistics, National Longitudinal Survey of Youth (1979-2020) and authors’ calculations.
Conceptually, three channels account for this pattern: a static effect of hours on earnings, a dynamic effect of hours on earnings and a selection effect. We will now discuss each of those channels.
The Static Effect of Hours on Earnings
To explain the static effect, consider two individuals with the same earnings potential. The one who works more than the other will likely receive higher earnings. To get a sense of how far the observed lifetime earnings in our sample of male workers (the solid blue line in the figure above) deviate from this benchmark, we added the dashed green line. It shows hypothetical earnings if lifetime earnings vary proportionally with lifetime hours worked (e.g., increasing lifetime hours by 10% would increase lifetime earnings by 10% as well). Values above the dashed green line indicate that lifetime earnings are larger than what differences in lifetime hours worked alone would suggest.
To give a concrete example, individuals in the group working between 2,500 and 2,749 hours work about 25% more hours in their lifetimes than individuals in the group working between 2,000 and 2,249 hours, while their lifetime earnings are about 40% higher than those in the latter group. In contrast, individuals in the group working between 1,500 and 1,749 work about 25% fewer hours in their lifetimes than individuals in the group working between 2,000 and 2,249 hours, while their lifetime earnings are about 40% lower. Hence, while lifetime earnings do increase with lifetime hours worked, the relationship is starker than the static effect by itself would imply. The next two channels provide some rationale for this.
The Dynamic Effect of Hours on Earnings
Working more hours is often a means to gain work experience, accumulate skills and acquire new knowledge. All of this raises work-related human capital and makes workers more productive in the future, increasing the possibility of promotions and better job opportunities. Hence, individuals who work more hours may receive lifetime earnings growth beyond the static effect.
The following figure offers evidence in favor of this channel. We plot the growth rate of earnings from ages 25 to 55 conditional on lifetime hours worked.In particular, we calculate average earnings within each group of lifetime hours worked at ages 25-29 and 51-55, respectively, and then measure the total growth rate. Individuals with annualized lifetime hours worked that were less than 1,500 do not see any earnings growth at all. Above this cutoff, earnings growth increases strongly with lifetime hours worked, with the exception of the group with the highest hours worked for whom earnings growth slows down somewhat.
Lifetime Earnings and Lifetime Hours Worked: Earnings Growth for Male Workers Ages 25 to 55
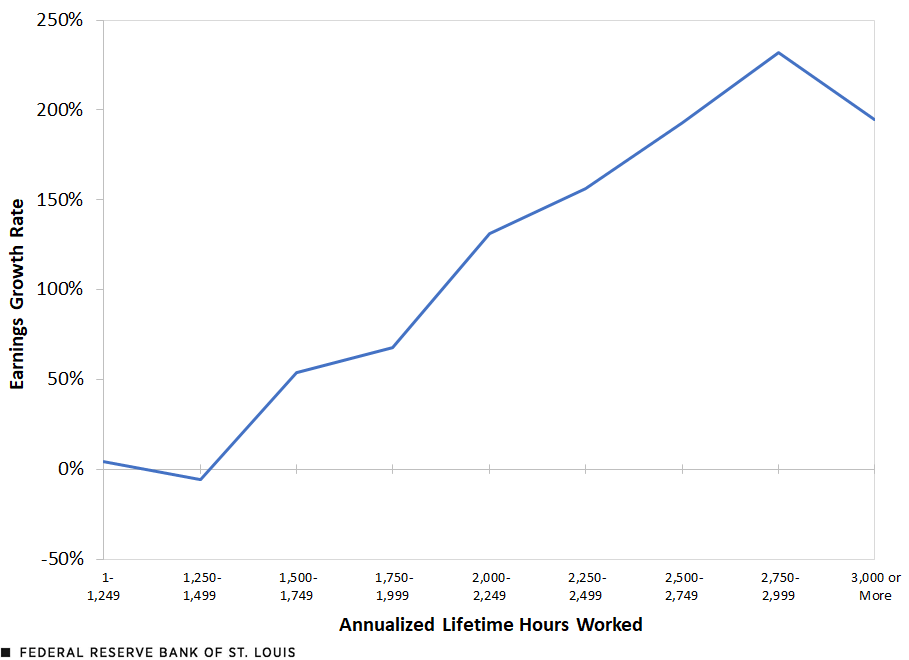
SOURCES: Bureau of Labor Statistics, National Longitudinal Survey of Youth (1979-2020) and authors’ calculations.
The Selection Effect
When introducing the static effect of hours worked on earnings, we considered two individuals with the same earnings potential. Now, let us consider two individuals with different earnings potential as well as different preferences or opportunities for working longer hours. If the worker with the higher earnings potential also prefers to work more than the worker with lower earnings potential, and thus works more hours, we would see a positive relationship between lifetime hours worked and lifetime earnings, as shown in the first figure. While one may find this type of selection intuitive, standard empirical methods are unable to identify how individuals with different lifetime hours worked compare in terms of their earnings potential and ability to acquire human capital. Quantitative, structural economic models can tackle this problem, if one is willing to accept their identifying assumptions. This is, however, beyond the scope of this blog post.
The Relationship between More Hours Worked and Lifetime Earnings
In this blog post, we document substantial variation in the hours that people work over their lifetimes. Except for individuals with very low lifetime hours worked, weekly hours worked are the most important driver behind this result. Differences in lifetime hours worked statistically explain about 30% of the variation in lifetime earnings, and higher lifetime hours worked are associated with both higher lifetime earnings and higher earnings growth over a career.
This raises an important question: Which economic mechanisms drive these relationships? One possibility is a static relationship, in which working longer hours in a given year raises earnings in that year. A second possibility is a dynamic relationship, in which working longer hours in the present year raises a worker’s skills or earnings potential in the future. A third possibility is selection, in which higher earners happen to work more, but these longer hours are not necessarily the reason for their higher earnings. More research is needed to disentangle these three possibilities.
Notes
- This is the R2 in a regression of lifetime earnings on lifetime hours worked.
- In particular, we calculate average earnings within each group of lifetime hours worked at ages 25-29 and 51-55, respectively, and then measure the total growth rate.


Citation
Alexander Bick, Adam Blandin and Richard Rogerson, ldquoWork More, Make Much More? The Relationship between Lifetime Hours Worked and Lifetime Earnings,rdquo St. Louis Fed On the Economy, March 12, 2024.
This blog offers commentary, analysis and data from our economists and experts. Views expressed are not necessarily those of the St. Louis Fed or Federal Reserve System.
Email Us
All other blog-related questions