Job Mobility Patterns and Lifetime Earnings Disparities among Male Workers
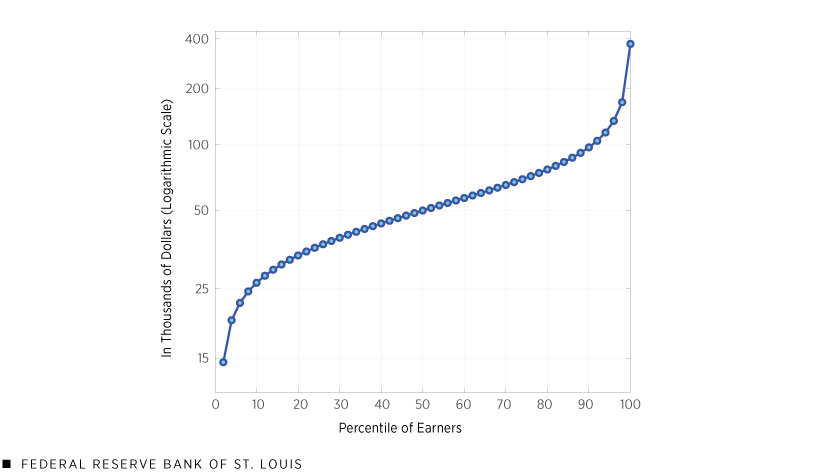
Workers differ greatly in their lifetime earnings, which we define as the average real wage and salary income earned during their life between ages 25 and 55. For example, among male workers, those at the bottom of the lifetime earnings (LE) distribution earn about $15,000 per year over the life cycle, whereas this number increases to $50,000 for median workers and further increases rather steeply to nearly $400,000 for the top 2% of earners.In this blog post, we focused on men because of the difficulties in getting uninterrupted earnings histories for women. However, we are working on a similar study that focuses on lifetime earnings inequality for women. (See the figure below.)
Average Annual Real Income Earned between Ages 25 and 55 for Male Workers

SOURCE: Serdar Ozkan, Jae Song and Fatih Karahan, 2022.
NOTE: Each point on the line represents a two-percentile increment.
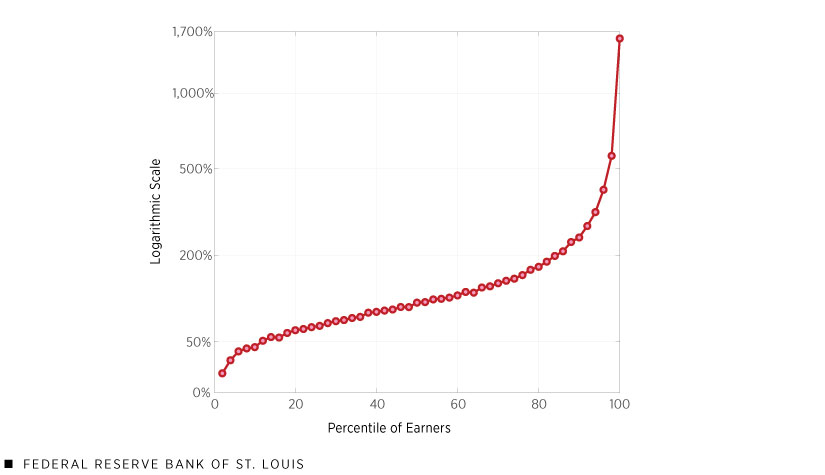
Even though inequality starts early in life, differences in earnings growth over the life cycle are key for understanding earnings inequality. The second figure shows these large differences in average earnings growth for men across the lifetime earnings distribution. Those at the top of the lifetime earnings distribution saw their incomes rise by more than 17-fold between 25 and 55.The growth of average real earnings is calculated using the ratio of average earnings at age 55 to average earnings at age 25. Median workers experienced more than a twofold increase, and those at the bottom saw essentially no earnings growth, a mere 16% growth.
Average Real Earnings Growth between Ages 25 and 55 for Male Workers

SOURCE: Serdar Ozkan, Jae Song and Fatih Karahan, 2022.
NOTE: Each point on the line represents a two-percentile increment.
What explains these vast differences in earnings growth over the male working life? Are some workers better at learning on the job than others and, in turn, experience higher salary increases for the same job? Or are they better at climbing the job ladder because they have lower unemployment risk and a higher job finding rate, and are more likely to be poached? Does this, in turn, cause them to experience steeper earnings growth when switching jobs, whereas others suffer from job instability and spend more time unemployed? With more people than ever switching jobs, answers to these questions are particularly important in the current economic environment.See this Department of Labor article about the impact of the pandemic on hiring and turnover. In this blog post, we discuss how the job mobility patterns for men of different income groups can inform us on these forces.This blog post is based on a working paper by authors Serdar Ozkan, Jae Song and Fatih Karahan, “Anatomy of Lifetime Earnings Inequality: Heterogeneity in Job Ladder Risk vs. Human Capital,” November 2022.
Job Ladder and Careers
The anonymized data come from the confidential employer-employee matched panel of the entire earnings histories of male workers between 1978 and 2013, provided by the U.S. Social Security Administration from employees’ W-2 forms. Our discussion is based on a sample of wage and salary workers with strong labor market attachment. For further details, see Serdar Ozkan, Jae Song and Fatih Karahan’s 2022 working paper.
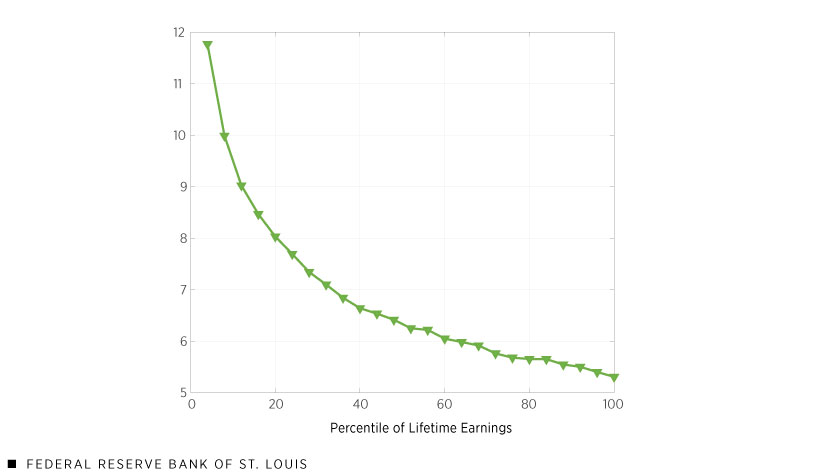
Earlier work has shown that job mobility is important for earnings growth over the life cycle. We start by investigating the different job mobility patterns of male workers across the LE groups. Between ages 25 and 55, only 30% of male workers at the bottom of the LE distribution stayed with the same employer two full consecutive years, compared with around 60% for male workers above the median. Resonating with these large differences, bottom LE individuals worked for about 12 different employers during their lifetime—more than twice as many as those above the median. (See the figure below.)
Average Number of Different Employers during Male Workers’ Lifetime (Ages 25-55)

SOURCE: Serdar Ozkan, Jae Song and Fatih Karahan, 2022.
NOTE: Each point on the line represents a four-percentile increment.
How Job Switches Affect Earnings Growth
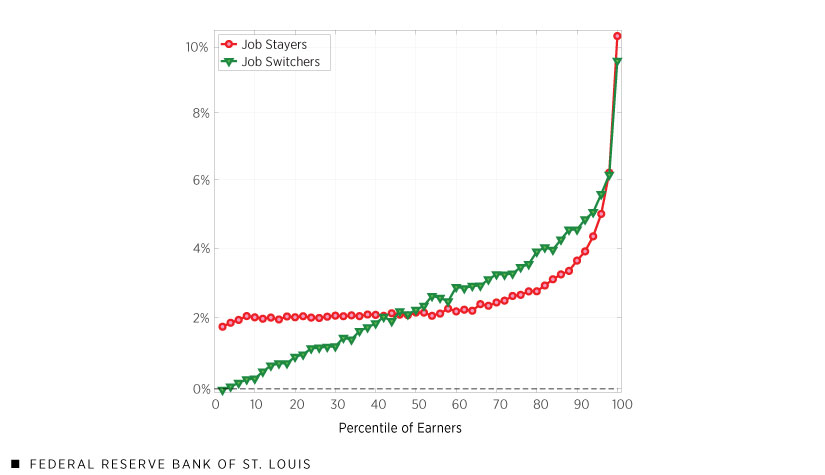
Low-income workers are more likely to change employers, but how much do job switches help earnings growth? Next, we investigate the effect of switching jobs on earnings growth for different LE groups. Average annual earnings growth for job stayers is surprisingly similar, around 2% in the bottom two-thirds of the LE distribution, whereas for job switchers, it rises almost linearly from 0% for the bottom earners to around 3% for those in the 65th percentile. (See the fourth figure.)
For example, let’s consider two male workers, one in the bottom (in the first two percentiles) and the other in the 65th percentile of the LE distribution. Both experienced on average a 2% growth in annual earnings if they stayed with the same employer. However, if they changed employers, the bottom earner did not see any growth in his earnings, whereas the 65th-percentile earner enjoyed, on average, 3% growth.
This large heterogeneity among switchers indicates that the nature of job switches is very different throughout the LE distribution. More than 35% of job switches were a result of a significant unemployment spell for the bottom earners, compared with only around 15% in the top third of earners, suggesting a much higher unemployment risk for bottom earners. Finally, earnings growth for both job stayers and job switchers increases steeply in the top third, reaching around 10% for the highest earners.
Average Annual Real Earnings Growth during Male Workers’ Lifetime by Job Mobility

SOURCE: Serdar Ozkan, Jae Song and Fatih Karahan, 2022.
NOTE: Each point on the line represents a two-percentile increment.
Given the similar earnings growth for job stayers below the median LE, the differences in earnings growth appear to be due to the differences in the frequency and nature of job switches among these male workers, suggesting large differences in job ladder risk (e.g., unemployment risk, job finding rate, rate of job offers from competing employers) between bottom and median earners. Job stayers’ growth differences, however, are likely the main driver in the upper half, because high LE workers rarely switch employers, hinting at differences in returns to work experience.
Lifetime Earnings Inequality among Men: Careers versus Jobs
Our descriptive analysis suggests that there are large differences in the career paths of individual male workers. Bottom earners are less likely to build a stable career because they have higher unemployment risks and a lower likelihood of moving to better employers. Workers above the median of the income distribution have more-stable jobs, so they differ mostly in returns to work experience.
To determine the appropriate policy response to the inequality in lifetime earnings, we need to exactly quantify the heterogeneity in job loss risk, job finding rate and contact rate by competing employers that leads to differences in stability of careers, as well as the heterogeneity in returns to experience. We will discuss the importance of these specific factors in our next post.
Notes
- In this blog post, we focused on men because of the difficulties in getting uninterrupted earnings histories for women. However, we are working on a similar study that focuses on lifetime earnings inequality for women.
- The growth of average real earnings is calculated using the ratio of average earnings at age 55 to average earnings at age 25.
- See this Department of Labor article about the impact of the pandemic on hiring and turnover.
- This blog post is based on a working paper by authors Serdar Ozkan, Jae Song and Fatih Karahan, “Anatomy of Lifetime Earnings Inequality: Heterogeneity in Job Ladder Risk vs. Human Capital,” November 2022.
Citation
Serdar Ozkan and Cassandra Marks, ldquoJob Mobility Patterns and Lifetime Earnings Disparities among Male Workers,rdquo St. Louis Fed On the Economy, Jan. 17, 2023.
This blog offers commentary, analysis and data from our economists and experts. Views expressed are not necessarily those of the St. Louis Fed or Federal Reserve System.
Email Us
All other blog-related questions


