


How Job Risk and Human Capital Shape Male Lifetime Earnings Disparities
In our previous blog post, we discussed the differences in job mobility patterns across the lifetime earnings (LE) distribution to shed some light on the determinants of inequality.Lifetime earnings are defined as the average real wage and salary income earned by workers between age 25 and 55. This descriptive analysis suggests that male earners at the lowest end of income distribution are less likely to build stable careers because they have higher unemployment risks and a lower likelihood of working for better employers.Recall that the underlying data are based on a sample of wage and salary prime-age male workers with strong labor market attachment. Our analysis focused on men because of the difficulties in getting uninterrupted earnings history for women. However, we are working on a similar study that focuses on lifetime earnings inequality for women. In contrast, male workers above the median of the income distribution have more-stable jobs, but they differ mostly in returns to work experience (or the ability to learn on the job).
In a 2022 working paper, economists Serdar Ozkan, Jae Song and Fatih Karahan used these descriptive facts to estimate an econometric model of job ladder risk—specifically, job loss risk, job finding rate and rate of job offers from competing employers—and human capital accumulation.This blog post is based on a working paper by authors Serdar Ozkan, Jae Song and Fatih Karahan, “Anatomy of Lifetime Earnings Inequality: Heterogeneity in Job Ladder Risk vs. Human Capital (PDF),” November 2022. They used the estimated model to provide exact measures of differences in job ladder risk as well as the heterogeneity in the ability to learn on the job. They also quantified the importance of these different factors for lifetime earnings inequality among men. In this blog post, we summarize their findings.
Heterogeneity in Job Ladder Risk
Ozkan, Song and Karahan’s model shows vast differences in job ladder risk, especially in the bottom half of the lifetime earnings distribution for male workers. Unemployment risk declines sharply as male workers’ lifetime earnings progress from the bottom to the median LE; it then remains essentially flat for individuals above the median. (See the first figure below.)
The quarterly job loss rateThe fraction of workers who lose their job over a quarter. for male workers at the bottom of LE distribution is around four times greater than that for workers above the median. For example, for the youngest age group, the rate declines from around 12% for the bottom-earners to less than 3% for median workers. It also generally declines over the life cycle (older workers face lower risk than younger workers), but this decline is dwarfed by the differences among income groups.
Quarterly Job Loss Rate among Male Workers, by Age Group
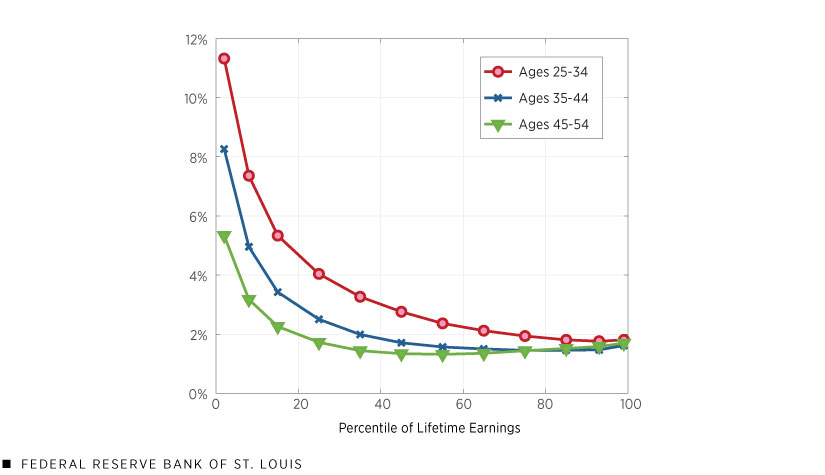
SOURCE: Serdar Ozkan, Jae Song and Fatih Karahan, 2022.
NOTE: The quarterly job loss rate is the fraction of workers who lose their job over a quarter.
Similarly, quarterly job findingThe probability of an unemployed worker finding a job over a three-month period. rates display large differences, from around 30% for male workers ages 25 to 34 who were at the bottom of the LE distribution to more than 60% for male workers ages 45 to 54 at the top. (See the second figure.) These estimates imply that the youngest group of workers at the bottom stayed unemployed for around three quarters, compared with less than two quarters for the oldest workers at the top of the LE distribution.
Coupled with an especially high job loss risk for low-income male workers, these job finding rates point to remarkable differences in employment: Bottom earners are employed about 25% less than those at the median, underscoring a less stable job ladder for them with fewer opportunities to learn on the job and to switch to better-paying firms.
Quarterly Job Finding Rate among Male Workers, by Age Group
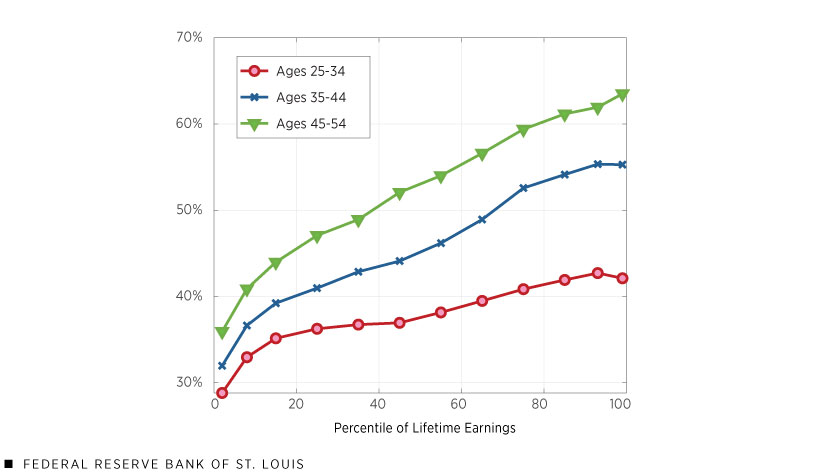
SOURCE: Serdar Ozkan, Jae Song and Fatih Karahan, 2022.
NOTE: The quarterly job finding is the probability of an unemployed worker finding a job over a three-month period.
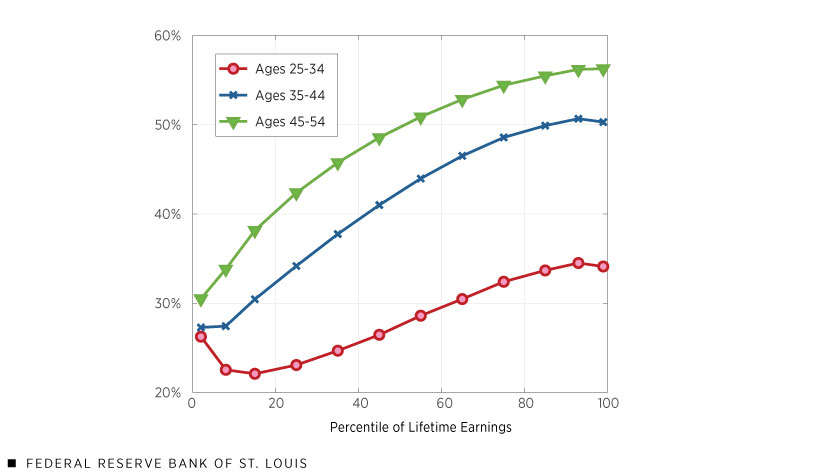
Turning to the job offer rate for employed male workers, we see that in the oldest age group, bottom LE workers have a 30% probability of receiving outside job offers in a quarter, relative to a 55% probability for the top workers. (See the third figure below.) Furthermore, this probability also increases over the life cycle.
Outside Job Offer Rate among Male Workers, by Age Group
Most Workers Have Similar Returns to Experience
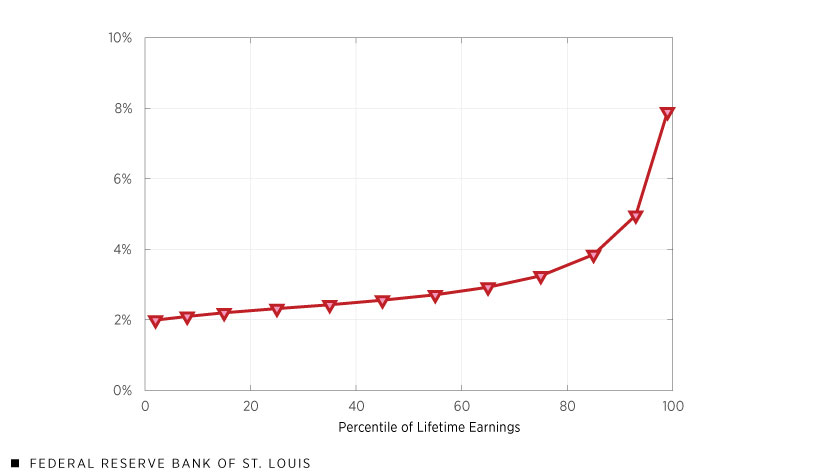
The fourth figure shows the average returns to each additional year of work experience across the lifetime earnings distribution; the returns are relatively flatter in the bottom half of LE distribution and increase steeply toward the top.
An additional year of work experience increases male workers’ wages by around 2% to 3% for workers below the 65th percentile of the income distribution, versus 8% for those at the top.
Annual Real Returns to Work Experience among Male Workers
Understanding Lifetime Earnings Inequality: A Tale of Two Economic Forces
These estimates provide a good account of the career trajectories of male workers discussed in our previous blog post. Ozkan, Song and Karahan’s working paper then used the model to decompose the differences in lifetime earnings. First, they found that differences in men’s wages—rather than employment—explain most of LE inequality. The only exception is that, as we discussed above, earners at the bottom of lifetime earnings are employed about 25% less than those at the median.
Second, Ozkan, Song and Karahan found that differences in lifetime wages for men are mainly driven by wage growth differences—rather than initial inequality at age 25. The authors then isolated the relative roles of job ladder risk and the returns to experience in wage growth differences. High unemployment rates among low LE workers reduce their wage growth by preventing them from learning on the job and from climbing the job ladder. Higher unemployment risk for bottom LE workers explains more than 50% of their lackluster wage growth relative to those at the median. Eliminating differences in outside job offer rates closes an additional 20% of the wage growth gap between workers at the bottom and those in the median by allowing low LE workers to move to better firms.
While heterogeneity in job ladder risk is important at the bottom half of the LE distribution, it explains very little of the differences above the median. In contrast, heterogeneity in returns to work experience drives almost all earnings growth differences above the median but only about 20% of these differences among the lower half. These findings suggest that that different economic forces are at play in different parts of the distribution, causing disparities in workers’ ability to progress economically in the labor market.
Notes
- Lifetime earnings are defined as the average real wage and salary income earned by workers between age 25 and 55.
- Recall that the underlying data are based on a sample of wage and salary prime-age male workers with strong labor market attachment. Our analysis focused on men because of the difficulties in getting uninterrupted earnings history for women. However, we are working on a similar study that focuses on lifetime earnings inequality for women.
- This blog post is based on a working paper by authors Serdar Ozkan, Jae Song and Fatih Karahan, “Anatomy of Lifetime Earnings Inequality: Heterogeneity in Job Ladder Risk vs. Human Capital (PDF),” November 2022.
- The fraction of workers who lose their job over a quarter.
- The probability of an unemployed worker finding a job over a three-month period.


Citation
Serdar Ozkan and Cassandra Marks, ldquoHow Job Risk and Human Capital Shape Male Lifetime Earnings Disparities,rdquo St. Louis Fed On the Economy, Jan. 19, 2023.
This blog offers commentary, analysis and data from our economists and experts. Views expressed are not necessarily those of the St. Louis Fed or Federal Reserve System.
Email Us
All other blog-related questions