


Military Expenditures: How Do the Top-Spending Nations Compare?
As the Russia-Ukraine war raises global tension and disrupts the world economy, it is useful to look at the patterns of defense spending around the world. The evolution of relative defense capabilities, among other factors, helps shape the course of the geopolitical balance of power.
In this blog post, we first identify the six nations with the highest military spending over the most recent five-year period (2017 to 2021). Then we discuss what seems to be driving the evolution of spending of these nations, and what that may indicate for the pattern of future defense spending around the world.
Top Six Nations in Terms of Defense Outlays
The following figure identifies the top six nations in terms of real defense spending (in constant 2020 dollars) since 1992, which is the first calendar year after the breakup of the Soviet Union and the resulting emergence of an independent Russia in December 1991. For expositional convenience, the rest of this piece will discuss these top six nations, although they may not represent the top nations using other metrics of defense spending. The U.S. had by far the largest military budget at $767.8 billion in 2021, but China’s outlay was also quite large at $270 billion. In comparison, the other four nations had more modest outlays, ranging from Saudi Arabia’s $53.8 billion to India’s $73.6 billion.Some of these values are estimates from the Stockholm International Peace Research Institute.
Top Six Countries by Military Expenditures
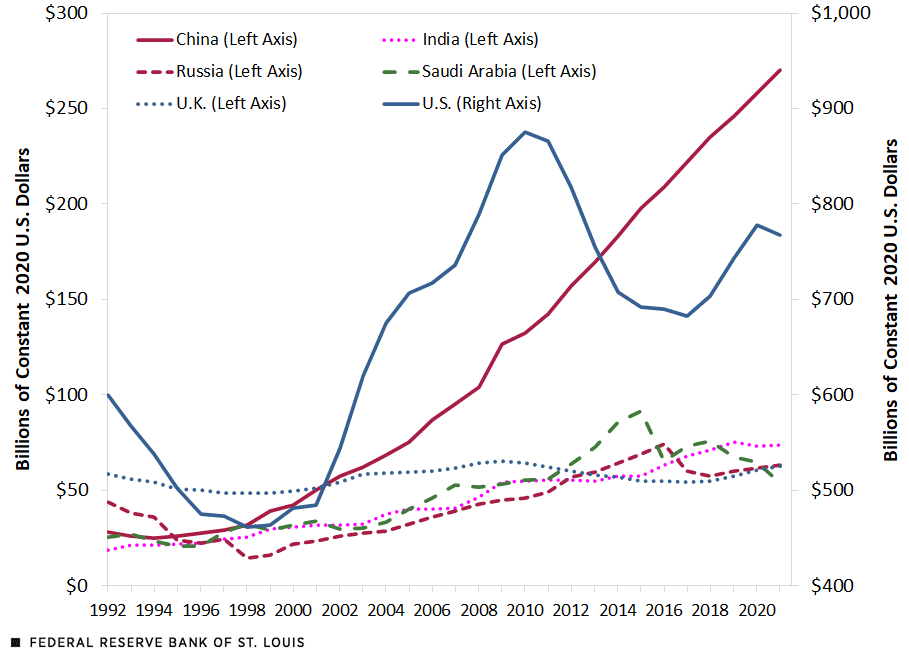
SOURCES: Stockholm International Peace Research Institute and authors’ calculations.
NOTE: The top six countries were those with the highest defense spending (in constant 2020 U.S. dollars) from 2017 to 2021.
What is quite remarkable is the evolution of China’s defense outlays in comparison to those of the other nations. Its defense spending in the early 1990s was lower than that of the U.K. and Russia, but rose steadily in the 2000s to exceed all other nations’ outlays except that of the U.S.
We turn next to the second figure to get some perspective on what may have driven these changes in defense expenditures.
Military Expenditures as a Percentage of GDP
The second figure presents defense outlays of the top six nations as a proportion of their respective gross domestic products (GDPs). Unlike what is shown in the first figure, China is no longer an outlier. Indeed, China’s 2021 defense spending was 1.7% of its 2021 GDP, which was the lowest share among the six nations in the figure. Furthermore, China’s defense-to-GDP ratio has been almost a flat line since 1992 at around 2%, suggesting that its defense outlays have grown almost proportionally to its GDP. In turn, this means that the rapid rise of China’s defense spending seen in the first figure reflects the rapid rise in its GDP. All nations, including China, have had defense-to-GDP ratios in the 1.5% to 5.5% range since 1992 except for Saudi Arabia, which had ratios as high as 14.3% in 1998 and 13.3% in 2015.
Military Expenditures as a Percentage of GDP
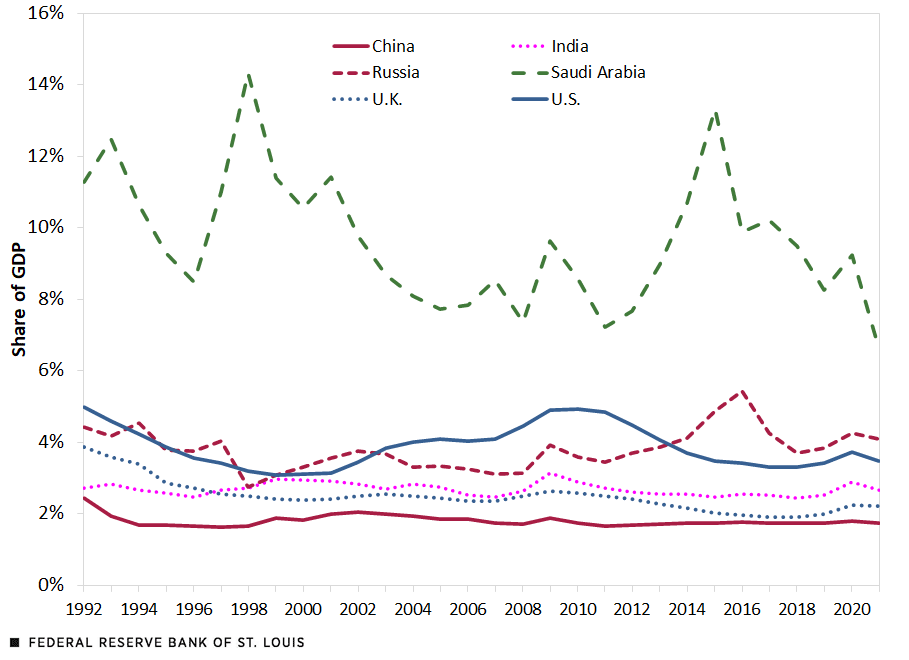
SOURCES: Stockholm International Peace Research Institute and authors’ calculations.
Foreign Military Outlays Relative to Those of the U.S.
The third figure traces the shares of military spending by the top six nations, except the U.S., relative to U.S. military spending. All nations except China spent less than a tenth of U.S. military spending in 2021, with China spending around a third of the U.S. level. Notably, the U.K.’s relative spending declined from 9.7% in 1992 to 8.1% in 2021, while India’s rose from 3.1% to 9.6% over the same period.
Other Countries’ Military Expenditures as a Percentage of U.S. Military Expenditures
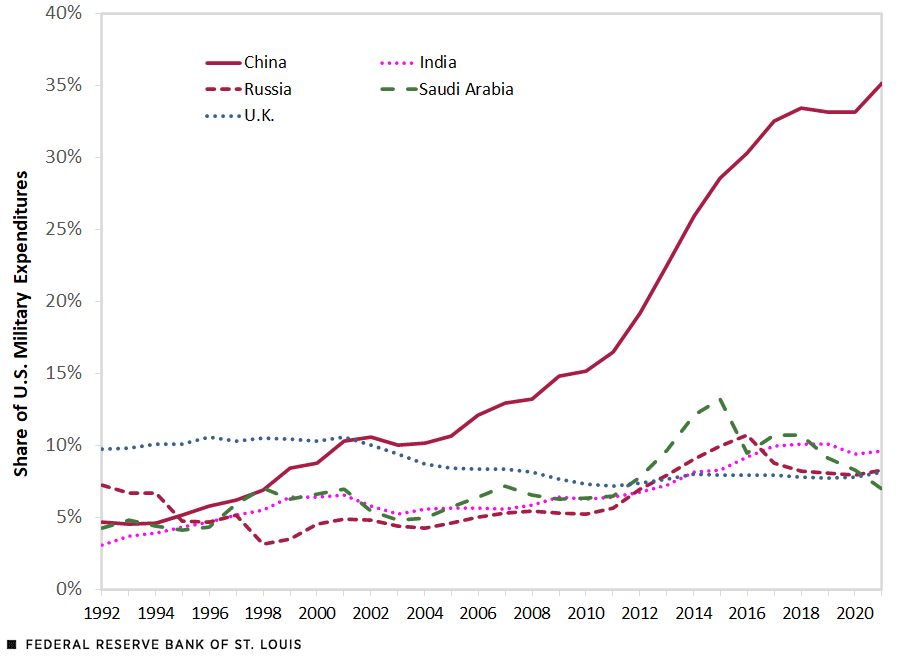
SOURCES: Stockholm International Peace Research Institute and authors’ calculations.
Potential Implications for Future Defense Spending
We find that among the top military spenders of recent years, most have had fairly stable ratios of defense spending to GDP since 1992. This is especially true for China and also for India, albeit to a lesser degree. In turn, this suggests that the size of the GDP of these (and other) nations in the coming years will be a major factor in determining their defense outlays. China’s rapid economic growth has enabled a correspondingly rapid rise in its defense capability, but its growth has slowed in recent years. Like China, India is also populous and, with a 2021 per capita GDP at around 3.3% of that of the U.S.,Calculated using data from the International Monetary Fund’s World Economic Outlook October 2022 database. it has the potential to grow. Actual growth outcomes of the different nations considered in this piece will depend on several factors, but their defense outlays will likely align with those growth outcomes.
Notes
- Some of these values are estimates from the Stockholm International Peace Research Institute.
- Calculated using data from the International Monetary Fund’s World Economic Outlook October 2022 database.


Citation
Subhayu Bandyopadhyay and Praew Grittayaphong, ldquoMilitary Expenditures: How Do the Top-Spending Nations Compare?,rdquo St. Louis Fed On the Economy, Jan. 3, 2023.
This blog offers commentary, analysis and data from our economists and experts. Views expressed are not necessarily those of the St. Louis Fed or Federal Reserve System.
Email Us
All other blog-related questions