


Inflation, Softer Jobs Market Challenge Vulnerable Workers
Persistent inflation and now a slowing labor market have the potential to further challenge certain vulnerable groups, particularly low- to moderate-income (LMI) families and out-of-school young Black and Latino adults (ages 16 to 24 with a high school diploma and no college education). The latter adults’ labor force attachments are generally weaker than those of the general population and their white peers, and their employment outcomes also tend to be more sensitive to changes in the economy.
This blog post has two goals:
- First, examine data from the U.S. Census Bureau’s Household Pulse Survey to gauge the ability of Black, Latino and LMI households to meet their expenses. This is an important consideration given the continued elevated inflation that households are facing.
- Second, expand on a November 2022 blog post that focused on labor market outcomes of out-of-school young adults. At that time, we found that the employment-population ratio of out-of-school young adults had decreased since job openings began to fall and since the Federal Open Market Committee (FOMC) began to raise its policy rate—the target range for the federal funds rate—in March 2022 to fight inflation.
The Inflation Squeeze
Inflation—as measured by the personal consumption expenditures price index—is still well above the FOMC’s 2% target but has been trending lower on a year-over-year basis since June 2022. However, wage growth is still not keeping pace with inflation. How might this dynamic vary by race, ethnicity and income?
To answer this question, we looked to the U.S. Census Bureau’s Household Pulse Survey. As of March 2023, Black and Latino households faced the highest rates of difficulty in meeting usual household expenses, which include food, mortgage or rent, auto payments, medical expenses and student loan payments. Almost 50% of Black and Latino families found it “somewhat difficult” or “very difficult” to meet their expenses. This contrasts with 34% of white families and 32% of Asian families. All percentages were higher than those 12 months earlier.
Also notable is that the rate of difficulty in meeting expenses was higher across all segments of the family income distribution compared with March 2022 and March 2021. But low-income families (those earning less than $50,000 annually) were still facing the most difficulties in paying their usual household expenses.
We also examined the intersection of race, ethnicity and income. For families with annual incomes of less than $50,000, about 60% of Black and Latino families reported difficulty in meeting their expenses. Also noteworthy is that nearly 52% of low-income white households reported difficulty in covering their usual family expenses.
The Labor Market Squeeze
Since the start of 2023, job openings and hiring rates have trended downward. Although initial claims for unemployment insurance benefits remain quite low, they have edged higher over the last three months.
The latest Bureau of Labor Statistics (BLS) jobs report also pointed to a slowdown in job growth. In March, nonfarm payroll employment increased by 236,000, whereas it had expanded by an average monthly gain of 334,000 over the prior six months.
The employment-population ratios from the BLS suggest continued stability in U.S. employment. However, the aggregate nature of the published data could cause us to miss growing weakness among vulnerable groups, especially young adults with the least education and fewest job skills.
As outlined in previous blog posts, the Institute for Economic Equity defines vulnerable groups as follows: young adults (ages 16-24), all adults with no more than a high school diploma,For a further breakdown of labor force statistics from the Current Population Survey, see the BLS. Black men and Black women, white women, and Latino men and Latina women.
Other groups and communities that face systemic and structural hurdles include out-of-school young adults,For a look at the college enrollment and work activity of high school graduates, see this release from the BLS. people with a disability,For a look at labor force characteristics of people with disabilities (PDF), see this release from the BLS. and American Indians and Alaska Natives.The BLS reported that the American Indian and Alaska Native jobless rate was twice the national unemployment rate in 2019. For this blog post, we also include rural workers and workers living in core urban areas.
Has the Jobs Slowdown Worsened for Out-of-School Young Adults?
Why focus on vulnerable workers such as out-of-school young adults? They can be viewed as canaries in a coal mine: In the context of the labor market, they are often the first to experience job losses and reductions in hours when the economy slows and the last to fully benefit from sustained economic growth. A 1 percentage-point change in the overall unemployment rate has a larger impact on labor market outcomes for these workers than it does for the general workforce.
To assess whether the slowdown has worsened for vulnerable groups, we looked at the cumulative percentage-point change in each vulnerable group’s employment-population ratio since February 2022. The earlier blog post estimated the changes from February 2022 to August 2022 and found that the employment-population ratio of out-of-school young adults had decreased by 1.8 percentage points. The largest decline was among out-of-school young Black adults, followed by out-of-school young Latino adults.
The data presented here extends the employment-population ratio analysis through February 2023. The following figure illustrates how out-of-school young adults and a few other groups have been affected by the decline in job openings and slower job growth; the groups below had experienced a downward trend in the ratio when the November post was published.
Extending the data (February 2022-February 2023) changes the picture. In particular, the employment-population ratios for out-of-school young Black and Latino adults showed a decline from February 2022 to February 2023 but not as severe as initially seen at the end of last summer.
Specifically, the ratios of Black and Latino young adults have fallen by 0.5 and 1.5 percentage points as compared with declines of more than 5 percentage points for both groups through August 2022.
Cumulative Change in Employment-Population Ratios, February-August 2022 and February 2022-February 2023
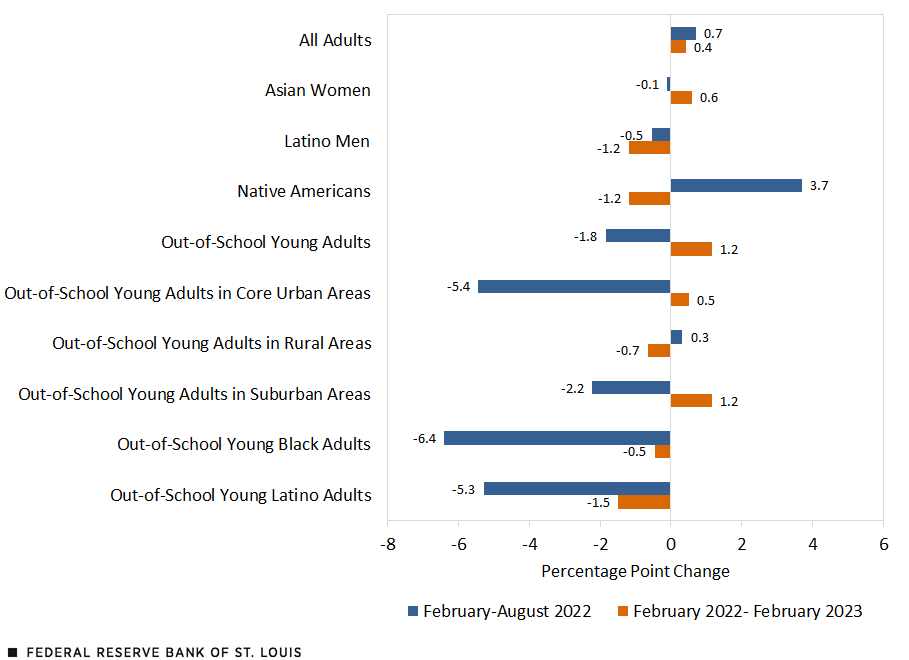
SOURCES: Current Population Survey and authors’ calculations.
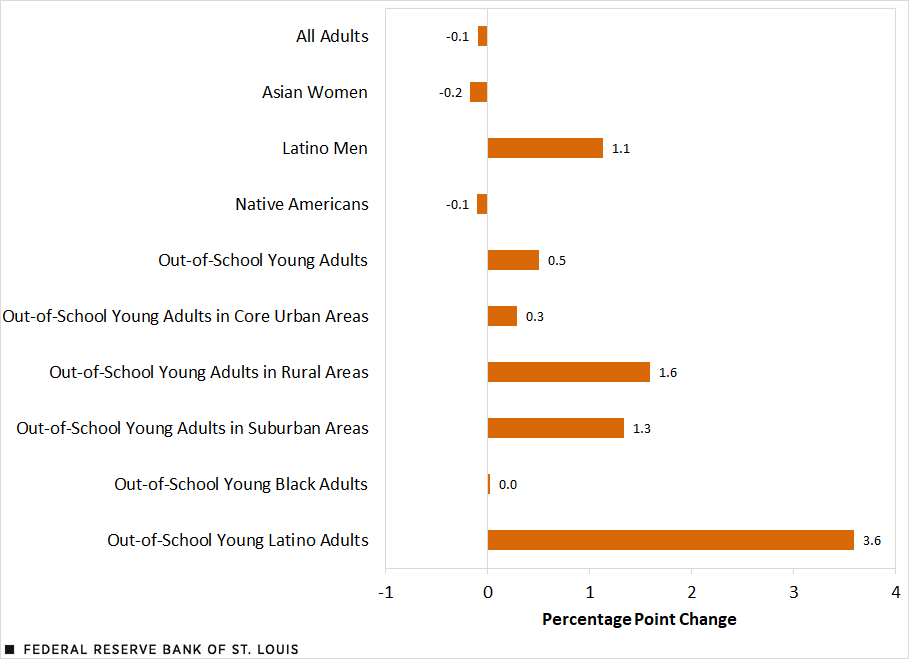
What may be the source of the decline in the employment-population ratios of out-of-school young Black and Latino adults? Is it tied to longer job searches (a higher unemployment rate) or a departure from the labor force (a decline in the labor force participation rate)?The employment-population ratio equals the labor force participation rate multiplied by the quantity 1 minus the unemployment rate. The next two charts display the cumulative changes from February 2022 to February 2023 in the unemployment and labor force participation rates.
Cumulative Percentage Point Change in Unemployment Rate, February 2022-February 2023
Cumulative Percentage Point Change in Labor Force Participation Rate, February 2022-February 2023
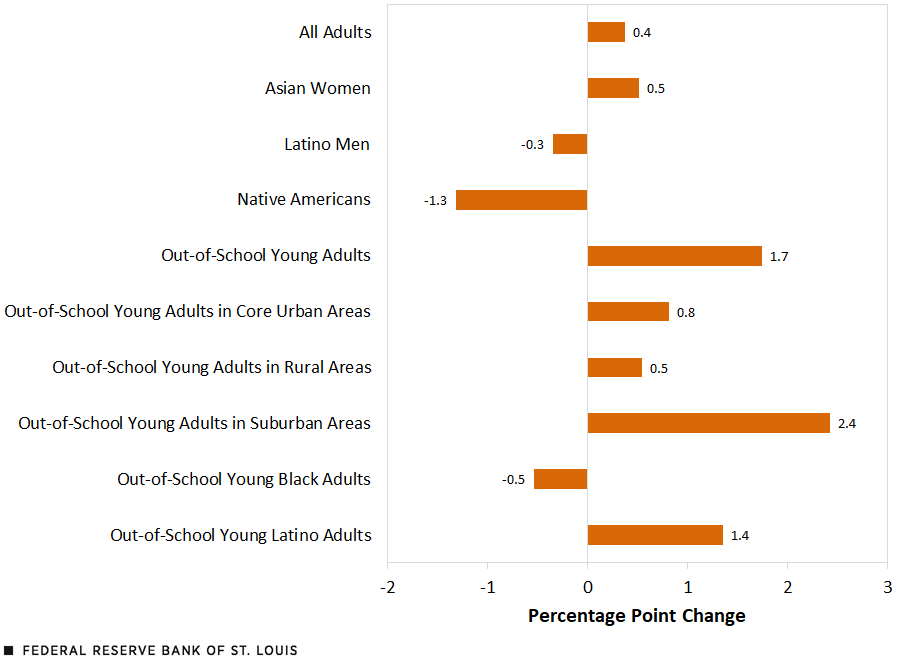
SOURCES FOR BOTH FIGURES: Current Population Survey and authors’ calculations.
From February 2022 to February 2023, the decline in the employment-population ratio of out-of-school young Black adults shown in the first chart appears, based on the second and third charts, to be related more to a departure from the labor force than to an increase in the number of unemployed people. The unemployment rate for the group increased by only 0.03 percentage points from February 2022 to February 2023, whereas its labor force participation rate declined by 0.5 percentage points.
The decline in the employment-population ratio of out-of-school young Latino adults from February 2022 to February 2023 is due to the 3.6 percentage point jump in their unemployment rate. This coincides with a 1.4 percentage point increase in this group participating in the labor force. This dual increase in unemployment and labor force participation might suggest that the slowing national job market is less able to absorb young Latinos who are seeking employment. If this pattern continues, in several months we may see their labor force participation rate fall.
Out-of-School Young Adults Also Have Less Earnings
Finally, out-of-school young adults also face the pinch of earning less on average than other workers. The inflation-adjusted (February 2023 dollars) average hourly earnings for all workers from March 2021 to February 2023 was $24.87 per hour. The average for all out-of-school young adults was $15.34 per hour.
Out-of-school young Black adults had the lowest average real hourly earnings among all vulnerable worker groups, sitting at $14.50 per hour. Among the groups for which estimates were constructed, out-of-school rural young adults had average hourly earnings of $15, the second-lowest of all nonenrolled young adults. Out-of-school young Latino adults earned an average of $15.64 per hour, slightly above the overall average for nonenrolled young adults.Authors’ calculations using the Census Bureau’s monthly Current Population Survey household micro data. All means are weighted.
On balance, the most recent BLS jobs report and Census Bureau’s Household Pulse Survey suggest a squeezing of the economic prospects for LMI families and out-of-school young adults. One source of pressure comes from the ongoing difficulty in meeting family expenses. The other comes from the outcomes that vulnerable workers are experiencing in the present labor market. Should pressures remain, these workers, their families and communities may become increasingly vulnerable and unable to meet household financial obligations.
Notes
- For a further breakdown of labor force statistics from the Current Population Survey, see the BLS.
- For a look at the college enrollment and work activity of high school graduates, see this release from the BLS.
- For a look at labor force characteristics of people with disabilities (PDF), see this release from the BLS.
- The BLS reported that the American Indian and Alaska Native jobless rate was twice the national unemployment rate in 2019.
- The employment-population ratio equals the labor force participation rate multiplied by the quantity 1 minus the unemployment rate.
- Authors’ calculations using the Census Bureau’s monthly Current Population Survey household micro data. All means are weighted.


Citation
William M. Rodgers III and Sophia Scott, ldquoInflation, Softer Jobs Market Challenge Vulnerable Workers,rdquo St. Louis Fed On the Economy, April 20, 2023.
This blog offers commentary, analysis and data from our economists and experts. Views expressed are not necessarily those of the St. Louis Fed or Federal Reserve System.
Email Us
All other blog-related questions