Out-of-School Young Adults Faring Poorly in Economic Slowdown
This blog post assesses whether the labor market outcomes of vulnerable groups have deteriorated since early this year.
The good news is that although job openings have declined since March, the employment of the typical worker has not eroded. However, the employment-population ratio of nonenrolled 16- to 24-year-olds with no more than a high school degree (out-of-school young adults) has decreased since job openings began to fall and since the Federal Open Market Committee (FOMC) began to raise the target range for the federal funds rate to fight inflation.
This deterioration among out-of-school young adults seems to be mainly due to losses in the retail trade sector. Yet, this blog post presents a cautionary pattern for many workers: either the start of a decline in their employment-population ratios or a slower pace of growth in their ratios.
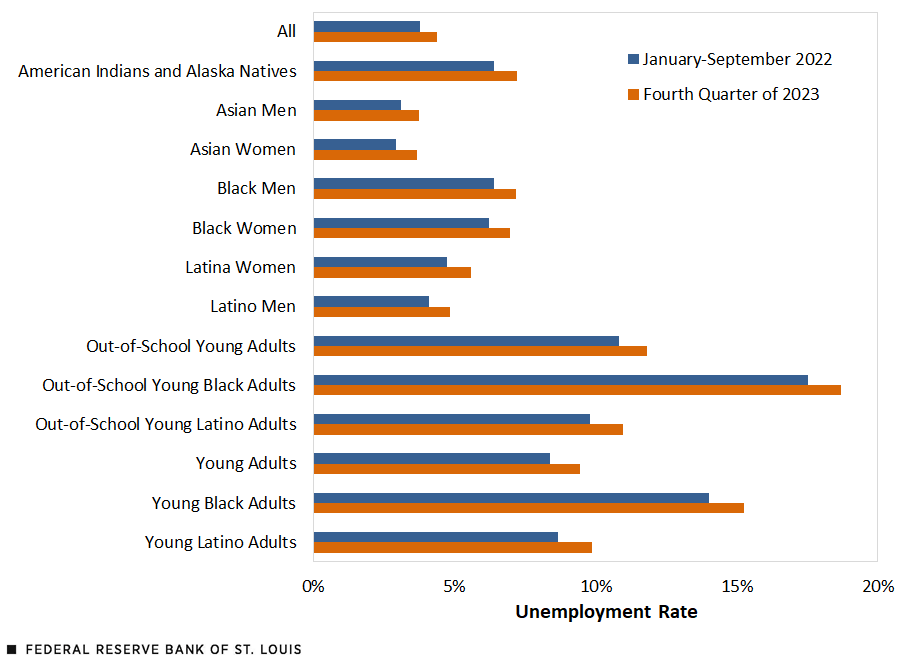
This blog post shows that based on a U.S. unemployment rate forecast of 4.4% in the fourth quarter of 2023, the unemployment rate for out-of-school young adults could reach nearly 12% during that period, with the jobless rate for out-of-school young Black adults potentially exceeding 18%.
Who Are Vulnerable Workers?
In a 2021 blog post, I defined vulnerable groups as those who are more sensitive to economic downturns and shocks. As shown in my Beveridge curve blog post with Institute for Economic Equity Research Fellow Alice Kassens, the labor market outcomes of vulnerable workers are more sensitive to changes in their state’s employment conditions. A 1 percentage point decrease in the state’s job openings rate has a larger negative impact on labor market outcomes for these vulnerable workers than it does for the general workforce. Therefore, in an economic slowdown, these groups are the first to lose their jobs or have them cut to part-time status.
The vulnerable groups are as follows: young adults (ages 16-24), all adults with no more than a high school diploma,For a further breakdown of labor force statistics from the Current Population Survey, see the BLS. Black men and women, white women, and Latino men and women. Other groups and communities also face systemic and structural hurdles. They include out-of-school young adults,For a look at the college enrollment and work activity of high school graduates, see this release from BLS. people with a disability,For a look at labor force characteristics on people with disabilities, see this release from BLS. and American Indians and Alaskan Natives.The BLS reported that the American Indian and Alaskan Native jobless rate was twice the national unemployment rate in 2019. The share of women employed during the same period was 53.5%, well below the economy-wide percentage of 60.8%. For this blog post, I also include rural workers and workers living in core urban areas.
Starting the Clock
When should the clock be started to measure whether the employment of vulnerable workers has deteriorated? To answer this question, I looked at when the FOMC began to increase the target range for the federal funds rate and when job openings began to decline.
The data suggest the clock started between February and April 2022. The FOMC raised the policy rate from its near-zero level in mid-March, with several increases since then. For job openings, there is a clear peak at 11.9 million in March of this year. As of September, openings were 10.7 million.Data from the Bureau of Labor Statistics’ Job Openings and Labor Turnover Survey lags the employer and household surveys by one month.
Based on these data, this blog post uses February as the starting point for exploring whether vulnerable workers were the first to experience the economic slowdown.
The Slowdown Has Hit Out-of-School Young Adults First
Next, I look at the cumulative percentage point change in each vulnerable group’s employment-population ratio since February 2022. This blog post uses the employment-population ratio because it captures changes in both search and labor force participation.
The vulnerable groups are sorted as follows:
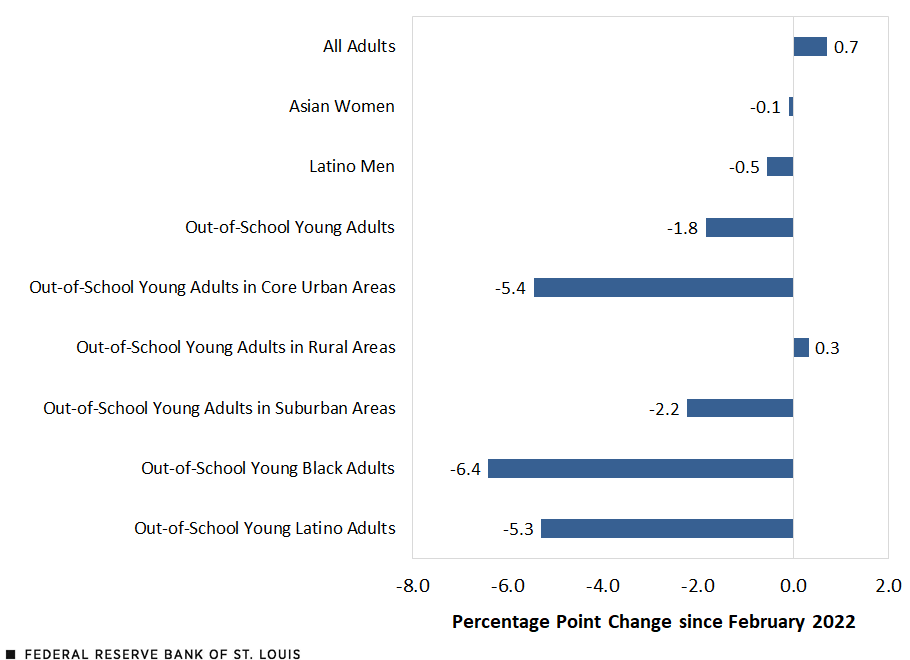
- The groups whose employment-population ratios have trended downward since the February; these include out-of-school young adults (overall and various subgroups), Latino men, and Asian women.The estimates are created as follows. First, I estimated the ratio for each group in a given month and year since February 2022. Second, I constructed a forward-looking three-month moving average of the ratio, starting with February, March and April as the first observation. The figure contains the cumulative change through August 2022.
- The groups whose ratios have started to fall in recent months; these include women, American Indians and Alaskan Natives, adults with no more than a high school diploma, adults with some college education, and workers living in core urban areas.
- The groups whose ratios have increased since early spring, but at a slower rate; these include Black men, Latina women, Asian men, suburban workers and rural workers.
The following figure illustrates how out-of-school young adults already have been affected by the economic slowdown. Although nonenrolled young Black and Latino adults have experienced the largest declines in their employment-population ratios since February, nonenrolled young adults of all races and ethnicities and of most places of residence have also seen declines.
Cumulative Change in Employment-Population Ratio, February-August 2022

SOURCES: Author’s calculations from the Current Population Survey household micro data.
What’s the source of the job losses for nonenrolled young adults? To answer this question, I first identified that just over one-fifth of these workers were employed in the leisure and hospitality sector in February 2022. Another 23% were employed in wholesale and retail trade, and 10% were in the construction sector.
I used data from the employer-based Current Employment Statistics to examine the cumulative job creation in these industries since February. The data suggest that the job losses for out-of-school young adults have been concentrated in the retail trade sector. Since February 2022, that sector’s employment growth has lagged other sectors. The U.S. Bureau of Labor Statistics’ (BLS) Job Openings and Labor Turnover Survey data corroborate this observation. Since February 2022, there has been a cumulative 30.2% decline in retail trade job openings, compared with a 5.7% decline in the overall private sector.
Looking Ahead to 2023
What might unemployment rates for vulnerable workers look like next year? The Survey of Professional Forecasters project the nation’s jobless rate to steadily rise from 3.7% in the fourth quarter of this year to 4.4% in the fourth quarter of 2023.
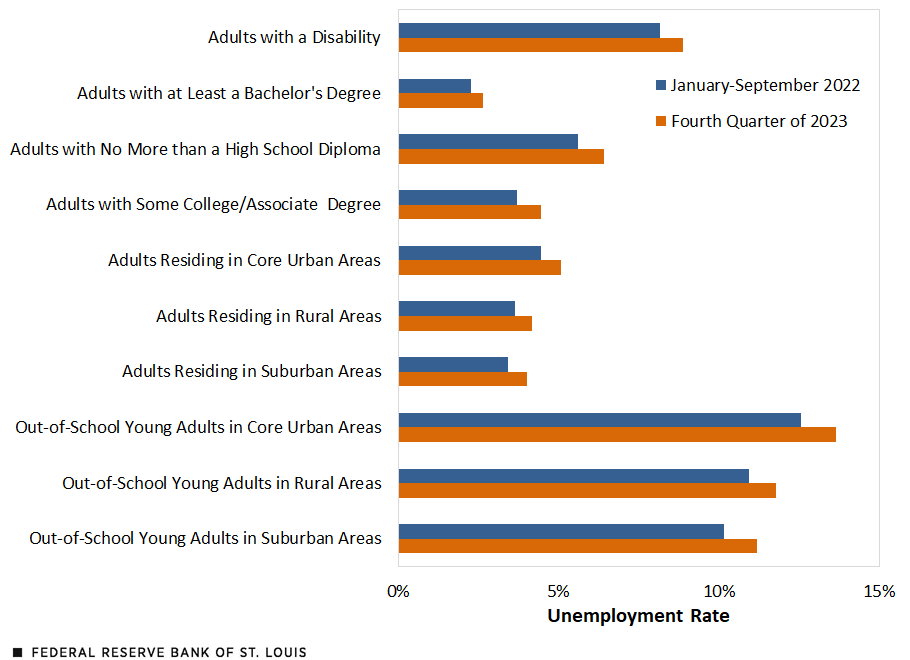
Using these forecasts and the estimated relationship between unemployment and the unemployment rate in each U.S. state, I constructed a predicted jobless rate for the fourth quarter of 2023 for each vulnerable group. These predictions are reported in the next two figures.
Predicted Unemployment Rates for Vulnerable Workers: By Race, Ethnicity, Gender and Age

Predicted Unemployment Rates for Vulnerable Workers: By Place of Residence, Disability Status and Educational Attainment

SOURCES FOR BOTH FIGURES: U.S. Bureau of Labor Statistics and author’s calculations.
NOTES FOR BOTH FIGURES: To obtain the predicted unemployment rate for a group, I first estimated the relationship between unemployment and the unemployment rate in each U.S. state. I then multiplied this coefficient by the predicted change in the U.S. unemployment rate from now until the fourth quarter of 2023.
Obviously, these are meant to serve as guide for the economy’s potential general direction. Much can occur between now and the fourth quarter of 2023. There remains a great deal of uncertainty that could impact these predictions. Hence, these estimates are subject to revision.
Furthermore, the risk to vulnerable workers is affected not only by the macroeconomy’s health. As shown in an October Beveridge curve blog post, vulnerable groups experience a variety of structural barriers to labor force participation, and out-of-school young adults have some of the biggest barriers. Therefore, these estimates could be viewed as lower-bound estimates.
However, I maintain the posture developed in the Beveridge curve blog posts. The benefits of proactively reducing the structural barriers to work for vulnerable workers exceed the costs of providing unemployment insurance and other reactive forms of relief.
In addition, this blog post’s evidence is consistent with the views of Ken Frazier, co-founder of OneTen and my recent guest on Conversations on Equity . Frazier, who is executive chairman of the board of directors at drugmaker Merck, made the case for employers to remove the college degree requirement on many of their job openings and hire based on skills. Doing so may help many of the out-of-school young adults who have lost their jobs.
Finally, the post presents a cautionary pattern for many adults. Albeit slowly, their employment-population ratios are showing early signs of erosion.
Notes
- For a further breakdown of labor force statistics from the Current Population Survey, see the BLS.
- For a look at the college enrollment and work activity of high school graduates, see this release from BLS.
- For a look at labor force characteristics on people with disabilities, see this release from BLS.
- The BLS reported that the American Indian and Alaskan Native jobless rate was twice the national unemployment rate in 2019. The share of women employed during the same period was 53.5%, well below the economy-wide percentage of 60.8%.
- Data from the Bureau of Labor Statistics’ Job Openings and Labor Turnover Survey lags the employer and household surveys by one month.
- The estimates are created as follows. First, I estimated the ratio for each group in a given month and year since February 2022. Second, I constructed a forward-looking three-month moving average of the ratio, starting with February, March and April as the first observation. The figure contains the cumulative change through August 2022.
Citation
William M. Rodgers III, ldquoOut-of-School Young Adults Faring Poorly in Economic Slowdown,rdquo St. Louis Fed On the Economy, Nov. 29, 2022.
This blog offers commentary, analysis and data from our economists and experts. Views expressed are not necessarily those of the St. Louis Fed or Federal Reserve System.
Email Us
All other blog-related questions


