


Inflation Is Still High and Widespread
Inflation has remained elevated since early 2021. Annual inflation, measured by the 12-month change in the personal consumption expenditures (PCE) price index, surpassed 2% in March 2021 and has remained above 6% since December 2021. It reached a peak of 7% in June 2022; the latest report, from August 2022, was 6.2%.Inflation is currently higher when measured as the 12-month change in the consumer price index (CPI). According to this measure, annual inflation was 8.2% in September 2022. To learn about the differences between CPI and PCE inflation, see St. Louis Fed President James Bullard’s recent Regional Economist article “Making Sense of Inflation Measures.” The figure below shows annual inflation rates since 2012 to put the present situation in context.
PCE Annual Inflation
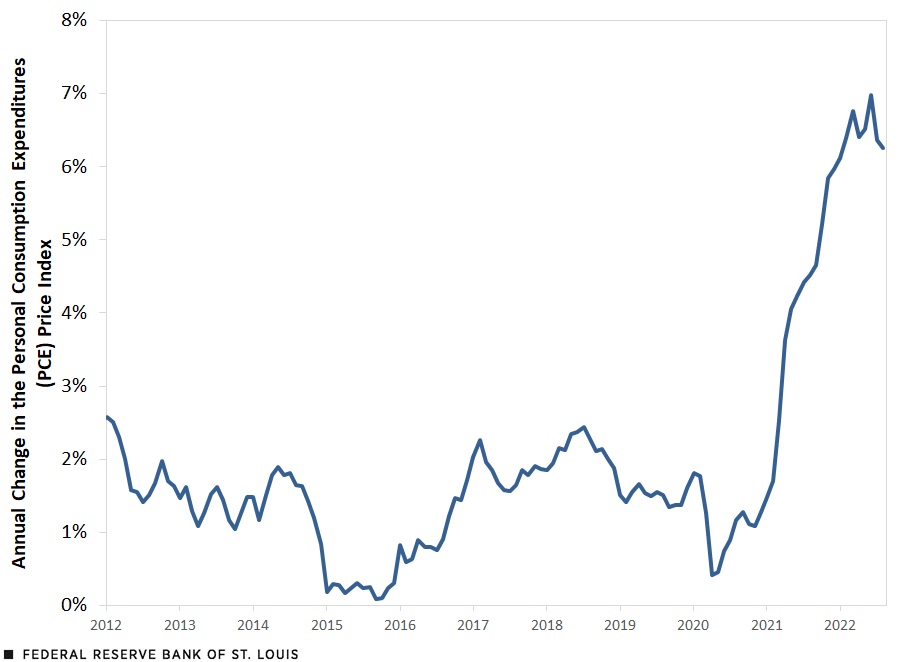
SOURCE: Bureau of Economic Analysis.
In a series of past blog posts, I have detailed the evolution of inflation and its distribution across product categories.See my blog posts from 2021 and earlier this year: “Is Inflation Making a Comeback?”; “What Are the Risks for Future Inflation?”; “How Widespread Are Price Increases in the U.S.?”; and “2021: The Year of High Inflation.” In this post, I will analyze the latest developments. Note that the Bureau of Economic Analysis (BEA) recently released revisions to its national income and product accounts (NIPA). Thus, some of the numbers used in this post are slightly different from those published in the past.
Inflation Remains High
The following table summarizes what has happened to inflation, according to various measures and different periods.
| All Goods and Services | Excluding Energy | Excluding Food and Energy (Core) | |
|---|---|---|---|
| 2016-19 | 1.8% | 1.7% | 1.8% |
| 2020 | 1.3% | 1.6% | 1.5% |
| 2021 | 6.0% | 5.1% | 5.0% |
| 2022 | 6.2% | 5.5% | 4.8% |
| COVID-19 | 4.4% | 4.0% | 3.7% |
| SOURCES: Bureau of Economic Analysis and author’s calculations. | |||
| NOTES: The 2022 period is the year through August. The COVID-19 period starts in March 2020 and ends in August 2022. | |||
The table shows inflation rates, measured as the change at an annual rate in the price index. I consider three price indexes using PCE: all goods and services; all excluding energy; and all excluding food and energy (core). There are several periods of interest. The first, 2016-19, covers a recent pre-pandemic period of relative price stability, with inflation close to the Federal Reserve’s 2% target. Next, are the years 2020 and 2021, as well as the current year up to August, which is the latest date available. The last period considered, COVID-19, covers the pandemic period, between March 2020 and August 2022. All inflation rates are annualized to make them comparable across periods of different lengths.
Regardless of how inflation is measured, the facts remain the same: After an initial decline at the onset of the pandemic, inflation accelerated and has remained elevated throughout 2021 and 2022. When we consider the entire period since the pandemic started (i.e., from March 2020 until August 2022), inflation has been 4.4% at an annual rate. If we exclude the contribution of energy, this figure drops to 4.0%; dropping both food and energy, we get 3.7%, which is still high relative to the Federal Reserve’s 2% target.
How Widespread Is Inflation?
We can look at inflation for the three major categories of consumption expenditures: nondurable goods, durable goods and services. The table below shows inflation rates for each of these categories for the various periods considered. Roughly speaking, nondurable goods represent about 22% of total PCE, durable goods account for 12% and services 66%. I include an additional table with four specific categories: food, energy, housing, and health care, which together make up more than 40% of consumption expenditures.
| Nondurable Goods | Durable Goods | Services | |
|---|---|---|---|
| 2016-19 | 1.0% | -1.9% | 2.6% |
| 2020 | -1.0% | 1.4% | 2.0% |
| 2021 | 7.8% | 9.1% | 4.8% |
| 2022 | 11.2% | 4.1% | 5.0% |
| COVID-19 | 5.7% | 5.1% | 3.9% |
| SOURCES: Bureau of Economic Analysis and author’s calculations. | |||
| NOTES: The 2022 period is the year through August. The COVID-19 period starts in March 2020 and ends in August 2022. | |||
All major spending categories experienced high inflation rates. The prices of nondurables declined in 2020 and have been rising significantly since March 2021. Much of this price dynamic is driven by food and energy. The price of food has been accelerating steadily, with annual inflation rates now in the double digits. In contrast, energy prices peaked in June 2022 and have declined since; however, they still contribute significantly to inflation rates in 2022.
Durable goods were the great contributors to inflation in 2020 and 2021. Prior to the pandemic, the price of durables had been steadily decreasing. The shift in consumer spending caused by the pandemic implied a robust increase in the demand for durable goods, with supply not catching up at the same pace. As a result, prices soared. Inflation in this category seems to have moderated significantly in 2022, as consumer spending patterns returned to normal.
The price of services has been trending upward at a slower pace than the price of goods. In part, the reason is the lack of demand for certain services (e.g., restaurants and travel) during the initial phases of the pandemic and the fact that many items are subject to annual contracts (e.g., rent, tuition and medical insurance). The inflation rate of services has remained above 4% annual since August 2021. Housing is one item whose inflation rate has accelerated significantly in 2022.
| Food | Energy | Housing | Health Care | |
|---|---|---|---|---|
| 2016-19 | 0.2% | 4.0% | 3.4% | 1.7% |
| 2020 | 3.9% | -7.8% | 2.2% | 2.6% |
| 2021 | 5.7% | 29.9% | 3.7% | 2.7% |
| 2022 | 14.3% | 22.4% | 7.0% | 2.7% |
| COVID-19 | 7.2% | 14.6% | 4.0% | 2.7% |
| SOURCES: Bureau of Economic Analysis and author’s calculations. | ||||
| NOTES: The 2022 period is the year through August. The COVID-19 period starts in March 2020 and ends in August 2022. | ||||
The figure below shows the real value of consumption expenditures by major component. Here, we can see that the boom in goods prompted by the pandemic has substantially abated. In contrast, services suffered a big initial decline but have now more than recovered. Given these expenditure patterns, we can expect that as the price and quantity of services continue to recover, inflationary pressures will remain elevated, though perhaps moderated by a stable or lower demand for goods.
Real PCE by Major Component
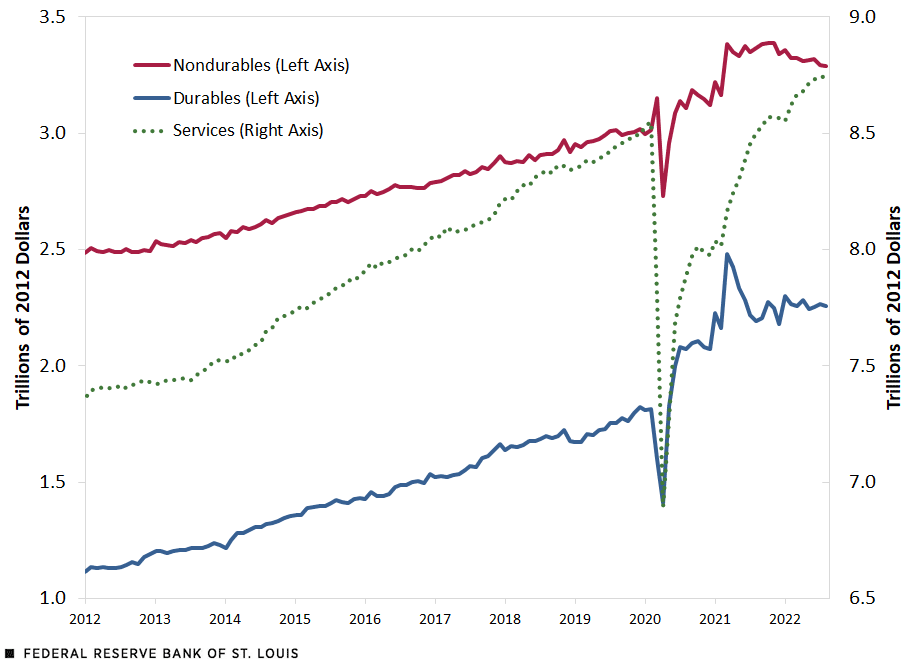
SOURCE: Bureau of Economic Analysis.
Finally, as in previous posts, we can look at the distribution of inflation across individual product categories. The disaggregated data published by the BEA consist of 244 product categories with monthly series on expenditures, prices, and real quantities.There is some double counting in the report, so the actual number of product categories is slightly smaller. See NIPA tables 2.4.4U, 2.4.5U and 2.4.6U. For each product category, I computed the annualized price change and the expenditure share in each period. The two figures below estimate the distribution of inflation across product categories, with annualized price changes on the horizontal axes and the corresponding expenditure shares on the vertical axes.For a full description of the methodology, see my blog post “How Widespread Are Price Increases in the U.S.?”
The first figure compares the distribution of annualized inflation rates for 2016-19 and the period since the COVID-19 pandemic started (March 2020 until August 2022). As we can see, the distribution of inflation rates has shifted to the right. That is, more products are registering higher inflation rates relative to the pre-pandemic period.
Estimated Distribution of Annualized PCE Inflation
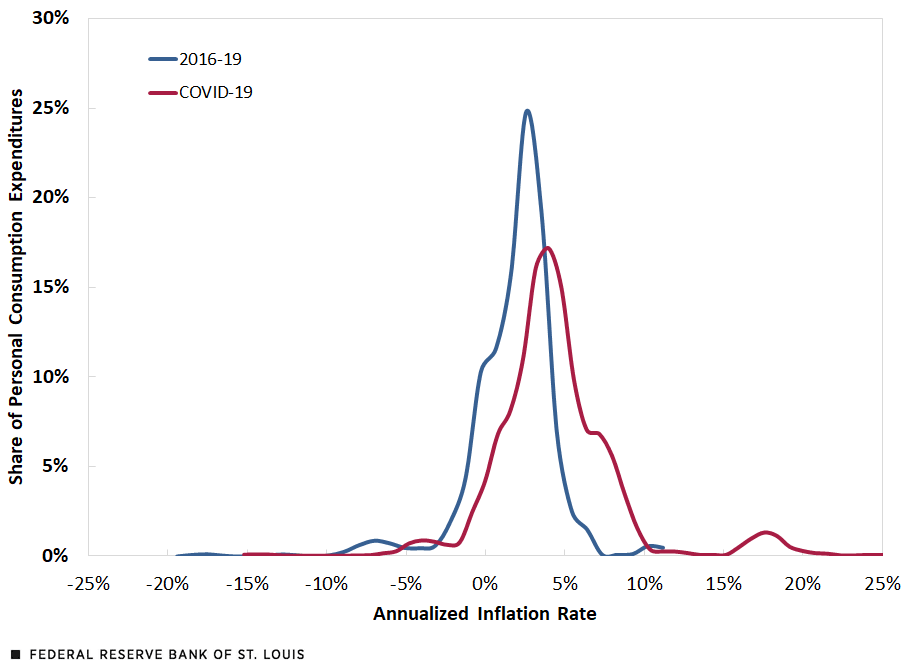
SOURCES: Bureau of Economic Analysis and author’s calculations.
NOTES: Distributions are computed with kernel density estimation in Stata, using the optimal bandwidth for each period. The COVID-19 period covers March 2020 to August 2022.
The second figure includes the pre-pandemic years and separates 2021 and 2022. Here we can see the gradual shift in the distribution of inflation rates across product categories. The role of outliers in explaining high inflation is minimal: Though there are still some categories registering very high inflation rates, what explains high overall inflation is the large mass of goods and services that are experiencing moderate to high inflation rates.
Estimated Distribution of Annualized PCE Inflation—Specific COVID-19 Years
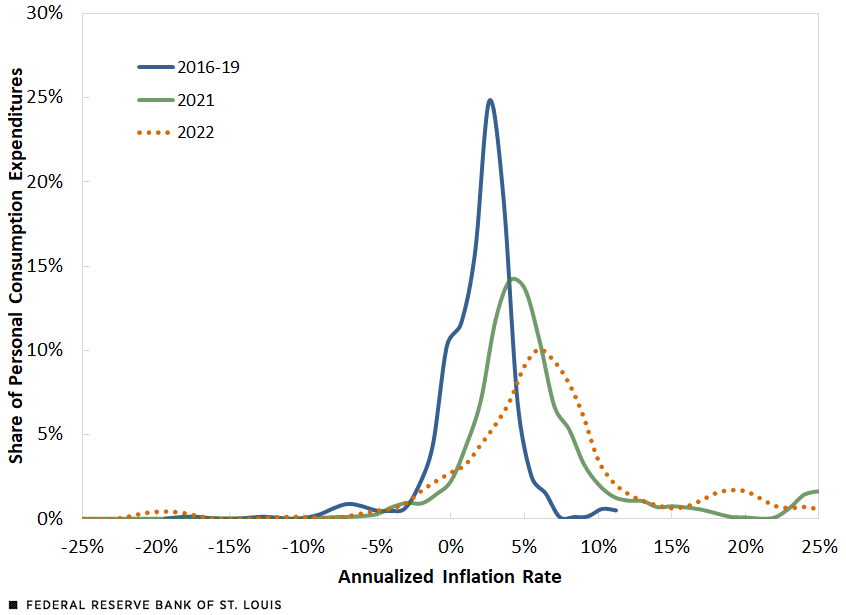
SOURCES: Bureau of Economic Analysis and author’s calculations.
NOTES: Distributions are computed with kernel density estimation in Stata, using the optimal bandwidth for each period. The year 2022 covers January to August.
Demand Factors
High inflation has been the result of supply and demand factors, which I have covered in past articles. Here, I will focus on overall demand pressures. The last figure shows disposable personal income and personal consumption expenditures, both in nominal terms, i.e., without removing the effect of inflation. I also include the 2000-19 trend to interpret these variables after the pandemic started.
Disposable Income and Consumption
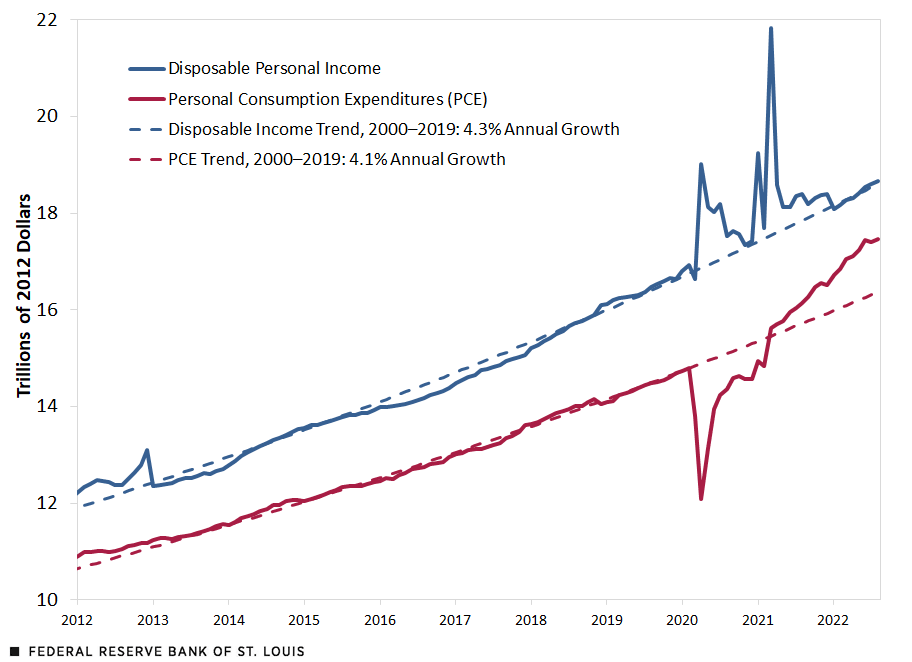
SOURCE: Bureau of Economic Analysis and author’s calculations.
As we can see, disposable income has been high in the pandemic period. In part, this is due to large transfer programs enacted by the federal government to provide relief to those affected economically by the pandemic. Since March 2020, the accumulated difference between actual disposable income and its projection from the pre-pandemic trend amounted to almost $1.5 trillion. Key to explaining this number were the three rounds of economic impact payments made by the federal government to households in 2020 and 2021, which totaled slightly over $800 billion.See the Pandemic Response Accountability Committee’s article “Three Rounds of Stimulus Checks. See How Many Went Out and for How Much.”
In contrast, consumption fell at the onset of the pandemic and recovered back to its pre-pandemic trend by March 2021. This is the same month when inflation crossed 2% annual. Since then, total consumption has remained well above trend. The accumulated difference between actual consumption and its projection from the pre-pandemic trend is roughly equal to zero.
That is, the initial shortfall in consumption has been made up. It is likely that inflationary pressures will persist, as excess savings continue to be spent.
Notes
- Inflation is currently higher when measured as the 12-month change in the consumer price index (CPI). According to this measure, annual inflation was 8.2% in September 2022. To learn about the differences between CPI and PCE inflation, see St. Louis Fed President James Bullard’s recent Regional Economist article “Making Sense of Inflation Measures.”
- See my blog posts from 2021 and earlier this year: “Is Inflation Making a Comeback?”; “What Are the Risks for Future Inflation?”; “How Widespread Are Price Increases in the U.S.?”; and “2021: The Year of High Inflation.”
- There is some double counting in the report, so the actual number of product categories is slightly smaller. See NIPA tables 2.4.4U, 2.4.5U and 2.4.6U.
- For a full description of the methodology, see my blog post “How Widespread Are Price Increases in the U.S.?”
- See the Pandemic Response Accountability Committee’s article “Three Rounds of Stimulus Checks. See How Many Went Out and for How Much.”

Citation
Fernando M. Martin, ldquoInflation Is Still High and Widespread,rdquo St. Louis Fed On the Economy, Oct. 17, 2022.
This blog offers commentary, analysis and data from our economists and experts. Views expressed are not necessarily those of the St. Louis Fed or Federal Reserve System.
Email Us
All other blog-related questions