


Will Inflation Play the Grinch This Holiday Season?
The U.S. economy has experienced another year of high inflation; consumer prices in October were 7.8% higher than they were a year earlier. And high inflation has more than offset income growth: Real (inflation-adjusted) per capita disposable personal income was 3.2% lower than it was a year ago.
Despite high inflation, retail industry experts are predicting healthy holiday sales growth of about 6% to 8% over last year. However, to get a clearer sense of the number of gifts friends and family may expect, we need to consider how higher prices of these goods may be driving this sales growth. Building off a similar blog post last year, we will take a closer look at the degree of inflation that consumers can expect as they begin shopping for gifts this holiday season.
Historical Price Trends
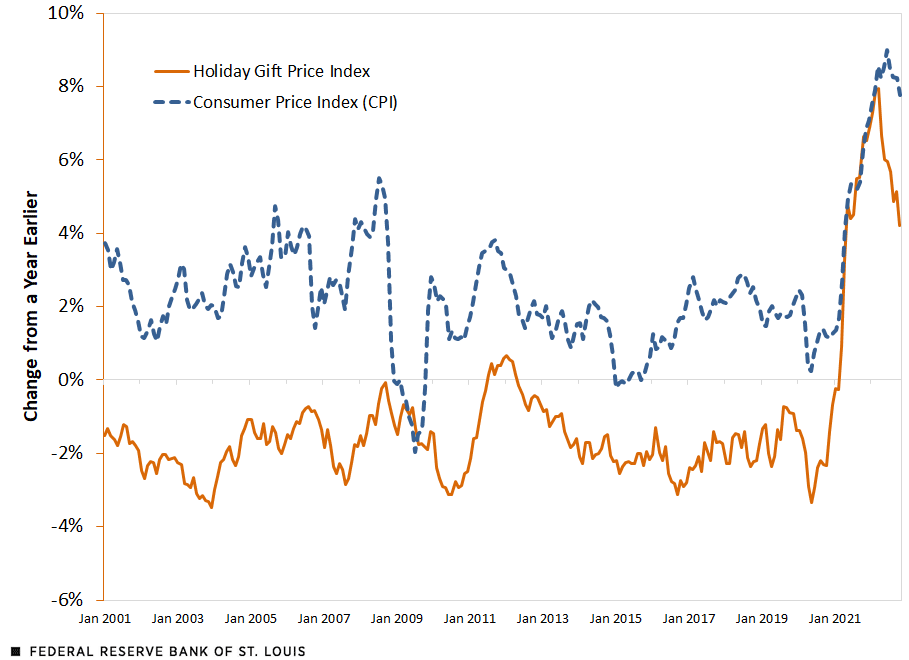
Within the often-cited consumer price index (CPI), we can look at price indexes and inflation rates for specific categories of goods and services related to the holiday season. The figure below shows the average inflation rate of quintessential holiday items—such as clothing, toys and wrapping paper—along with the overall CPI inflation rate since 2001.
Annual Price Change for Holiday Items vs. CPI
SOURCES: Bureau of Labor Statistics and authors’ calculations.
NOTES: The holiday gift price index is the average inflation rate for the following categories: footwear, furnishings, gift wrap and stationery, household furniture, infant apparel, jewelry, men's apparel, new cars, postage, sporting goods, tools, toys, TVs and women's apparel. Overall inflation is the CPI for all urban consumers.
CPI inflation from 2001 to 2019 averaged 2.1%, while the average price for our basket of holiday gifts averaged -1.7%, indicating falling prices of gifts prior to the pandemic. Prices have risen sharply in the past few years, and at the end of 2021, these holiday gifts cost an average of 6.9% more than they did in 2020. Currently, the index suggests that consumers could again find holiday gifts prices rising, on average 3.4% higher than they were a year ago.
Breaking Down Holiday Inflation by Spending Categories
The table below provides additional details on the inflation rates of selected gifts, as well as other holiday expenditures.
| Average (2001-2019) | 2020 | 2021 | 2022 (Annualized) | |
|---|---|---|---|---|
| Overall CPI | 2.1% | 1.3% | 7.1% | 7.7% |
| Food | 1.9% | 3.9% | 6.5% | 13.3% |
| Holiday Travel (Average) | 3.1% | -17.5% | 25.7% | 29.2% |
| Airline | 0.6% | -19.4% | 0.7% | 45.6% |
| Gas | 5.7% | -15.7% | 50.6% | 12.8% |
| Holiday Gifts (Average) | -1.7% | -0.7% | 6.9% | 3.4% |
| Footwear | 0.5% | -2.2% | 6.0% | 1.1% |
| Furnishings | -3.4% | 0.9% | 5.2% | 5.9% |
| Gift Wrap and Stationery | 0.1% | -0.2% | 8.9% | 12.0% |
| Household Furniture | -0.9% | 2.2% | 13.8% | 6.7% |
| Infant Apparel | -0.4% | -5.3% | 4.6% | 3.0% |
| Jewelry | 1.3% | 1.1% | 7.3% | 0.9% |
| Men's Apparel | -0.5% | -3.4% | 7.6% | 0.3% |
| New Cars | 0.1% | 2.1% | 12.0% | 7.8% |
| Postage | 3.5% | 3.9% | 6.7% | 4.9% |
| Sporting Goods | -0.2% | 2.5% | 6.3% | 4.7% |
| Tools | -0.3% | 3.7% | 7.2% | 9.1% |
| Toys | -6.3% | -3.9% | 1.8% | 2.0% |
| TVs | -16.6% | -4.8% | 4.7% | -16.8% |
| Women's Apparel | -0.7% | -6.2% | 4.3% | 5.4% |
| SOURCES: Bureau of Labor Statistics and authors’ calculations. | ||||
| NOTES: Historical values are the percent change in prices through December of the given year. Values for 2022 are annualized year-to-date inflation rates through October; that is, we show how much prices will increase in 2022 if the current rate of growth continues through December. We rely on seasonally adjusted series, so our method is unlikely to be affected by typical seasonal price changes. | ||||
For those looking to surprise a loved one with a big-ticket item like a new car or furniture, prices are on track to be 7.8% and 6.7% higher than last year's, respectively, if inflation continues at its current pace. On the other hand, prices of jewelry and watches are on pace to increase by about 0.9%, which is slower price growth than the 7.3% in 2021. Good news for children, the price of toys has remained relatively stable for another year, increasing by about 2%. The one price that might surprise buyers is that for new TVs, which has fallen 16.8% since last year, and after increasing for the first time in over a decade in 2021. Regardless of what gifts you decide to buy this year, 2022 could be the year of homemade cards and newspaper wrap, because stationery and gift wrap prices have skyrocketed 12%.
Hosting Family and Traveling May Be Much More Expensive
Although we found that average holiday gift inflation is expected to be less than the overall CPI inflation, this holiday season could still be much more expensive when we look beyond the prices of gifts. Those traveling this year can expect to see higher prices: Gasoline prices are up 12.8% from what they were a year ago, and airline ticket prices have surged 45.6%, as post-pandemic leisure travel has rebounded.
If you decide to host family and friends at home this season, you can expect a significantly higher grocery bill than last year's, because food at home is 13.3% more expensive. Cookies and candy are about 18.6% and 14.7% more expensive, respectively, while beer and wine for your meal should cost only slightly more (5.5%) than they did last year.
Other Considerations for Holiday Spending
Inflation is top of mind for many U.S. consumers entering this holiday season, yet current prices don’t fully predict future consumer spending patterns. Because of the pandemic surge in demand for goods and supply-chain disruptions over the last few years, retailers have been aggressive in placing advance orders for this holiday season. Currently, retail inventories are about 20% higher than they were at the same time last year, and consumers are increasingly more price sensitive. According to the National Retail Federation, about three-quarters of consumers consider discounts and promotions to be an important factor in their buying decisions.
Given the elevated inventory levels, lower real incomes, higher travel costs and increased price sensitivity, promotions may play a larger role in driving holiday sales volumes this year. The CPI data collectors will carefully account for any discounts in measuring consumer prices.Read more about how the Bureau of Labor Statistics calculates CPI (PDF).
Note
- Read more about how the Bureau of Labor Statistics calculates CPI (PDF).


Citation
Charles S. Gascon and Cassandra Marks, ldquoWill Inflation Play the Grinch This Holiday Season?,rdquo St. Louis Fed On the Economy, Nov. 22, 2022.
This blog offers commentary, analysis and data from our economists and experts. Views expressed are not necessarily those of the St. Louis Fed or Federal Reserve System.
Email Us
All other blog-related questions