Foreclosure Rates and On-Time Mortgage Payments during COVID-19
The percentage of residential mortgage loans with on-time payments fell significantly in 2020. This was the biggest drop in the share of current accounts since the global financial crisis, yet a wave of foreclosures didn’t occur, according to a recent Regional Economist article.
In the article, economist and Assistant Vice President Juan M. Sánchez and Research Associate Olivia Wilkinson examined the pattern of noncurrent loans during the COVID-19 pandemic.
Historically, noncurrent loans can progress to the point at which many end up in foreclosure, the authors noted. However, amid this pandemic, almost all noncurrent loans avoided foreclosure.
Breakdown of Noncurrent Loans
Sánchez and Wilkinson used a loan-level data set (McDash) from Black Knight that has information on about two-thirds of the U.S. mortgage market. They then broke down noncurrent loans by status.
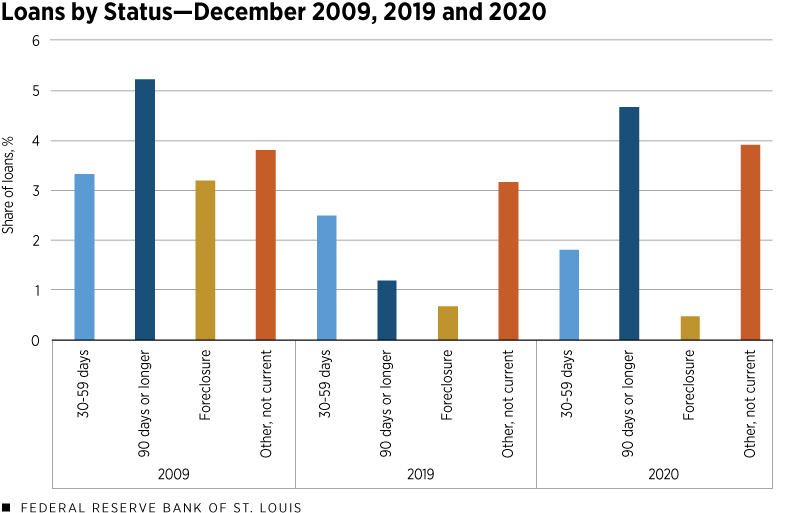
The figure below shows the December breakdown of noncurrent loans by status for three different years: 2009, which represents the peak of nonpayment during the Great Recession; 2019, which represents the pre-pandemic situation; and finally 2020 to capture the COVID-19 pandemic, they wrote.

SOURCES: Black Knight Inc.’s McDash data and authors’ calculations.
This figure shows two main points on which to focus, the authors noted.
- The percentage of loans at least 90 days overdue was significantly higher in December 2020 (at 4.7%) than in the previous year, and the 2020 number was only about a half a percentage point lower than in 2009.
- The mildly late status (30 to 59 days overdue) and foreclosure percentages in December 2020 were much lower than in December 2009. The mildly late status was also lower in 2020 than in 2019 because the surge in delinquencies occurred earlier in 2020.
“To understand these differences, we focused on what happened to loans that didn’t receive payments for three months during the pandemic and compared them to how things evolved during the financial crisis, they wrote.”
What Happened to Noncurrent Loans?
A portion of mortgages were selected to understand what happened to noncurrent loans. Sánchez and Wilkinson looked at loans that were current in February 2020 and had become 90 or more days overdue by June, and they then analyzed what happened to these loans in the following six months.
The authors found that 2.8% of the loans that were current in February 2020 were 90 or more days late by June 2020. Then they did a similar exercise for 2009, finding that about 0.7% of the loans that were current in February 2009 were late 90 days or longer in June 2009.
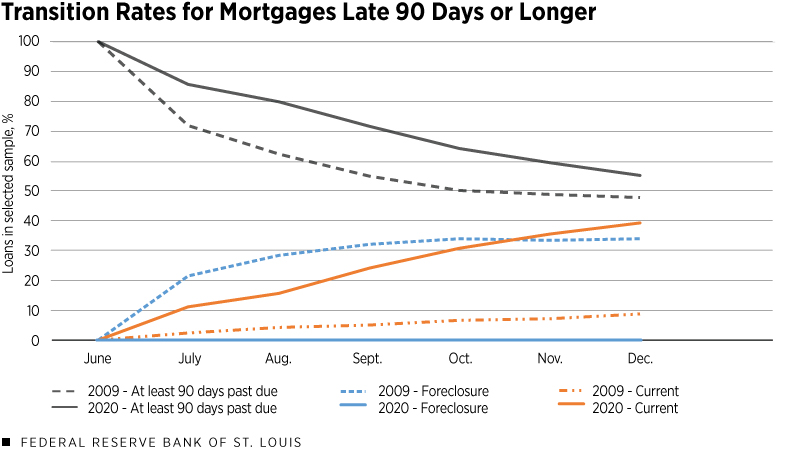
The figure below shows how these seriously delinquent loans progressed for the remainder of 2009 and 2020.

SOURCES: Black Knight Inc.’s McDash data and authors’ calculations.
In 2020, about 40% of the loans at least 90 days late in June ended the year being current, which is about four times the 2009 level, they observed.
Additionally, few loans transitioned to foreclosure in 2020, represented by the solid blue line, which stayed close to zero. Meanwhile, in 2009, 34% of loans at least 90 days late progressed to foreclosure, they pointed out.
“Thus, the main difference is that in 2009, a significant share of loans leaving the 90-days-late-or-longer status transitioned to foreclosure, while in 2020, as the economy recovered, these loans transitioned back to current status,” they wrote.
CARES and Stronger Housing Market
The authors noted that the federal government had stepped in to help borrowers. Passed in March 2020, the Coronavirus Aid, Relief and Economic Security (CARES) Act introduced provisions to suspend foreclosures and offered options for forbearance on federally backed mortgages.
Sánchez and Wilkinson also pointed out that a strong housing market in 2020 allowed troubled borrowers to able to sell their homes upon exiting forbearance and to pay in full instead of being foreclosed. Home values increased about 5% from June 2020 to December 2020, compared with a 2% drop during the similar period in 2009, they noted.
“Although the evolution of the share of current mortgages during the COVID-19 pandemic resembles what happened around the time of the financial crisis, there are important differences between these two episodes,” they concluded. “The clearest fact that distinguishes the two is the lack of a spike in foreclosures during the COVID-19 pandemic that was likely helped by the CARES Act and a stronger housing market.”
Additional Resources
Citation
ldquoForeclosure Rates and On-Time Mortgage Payments during COVID-19,rdquo St. Louis Fed On the Economy, Sept. 7, 2021.
This blog offers commentary, analysis and data from our economists and experts. Views expressed are not necessarily those of the St. Louis Fed or Federal Reserve System.
Email Us
All other blog-related questions

