Foreclosure Rate Drops during COVID-19 despite Dip in On-Time Mortgage Payments
KEY TAKEAWAYS
- On-time residential mortgage payments dropped drastically in 2020 amid the COVID-19 pandemic, but so did foreclosures.
- The CARES Act contained provisions suspending foreclosures and providing forbearance on federally backed mortgage loans.
- A strong housing market also helped troubled borrowers who were exiting forbearance to sell their homes rather than face foreclosure.
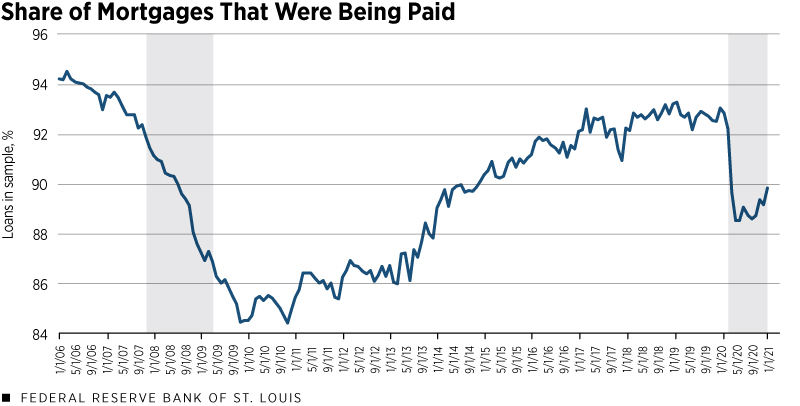
During the COVID-19 pandemic, the share of residential mortgage loans with on-time payments dropped drastically in 2020, according to loan-level data. This was by far the most significant decline in the share of current accounts since the global financial crisis,The global financial crisis lasted from 2007 to 2008. The resulting Great Recession officially lasted until mid-2009. as shown in the first figure.
Historically, these noncurrent loans progress from 30 days late to 60, and from 60 days late to 90, and eventually many end up in foreclosure. However, during the COVID-19 pandemic, nearly all noncurrent loans avoided being foreclosed.
This article discusses how this pattern changed during the pandemic and presents potential reasons for it.

SOURCES: Black Knight Inc.’s McDash data and authors’ calculations.
NOTE: Gray areas indicate recessions.
Breakdown of Noncurrent Loans
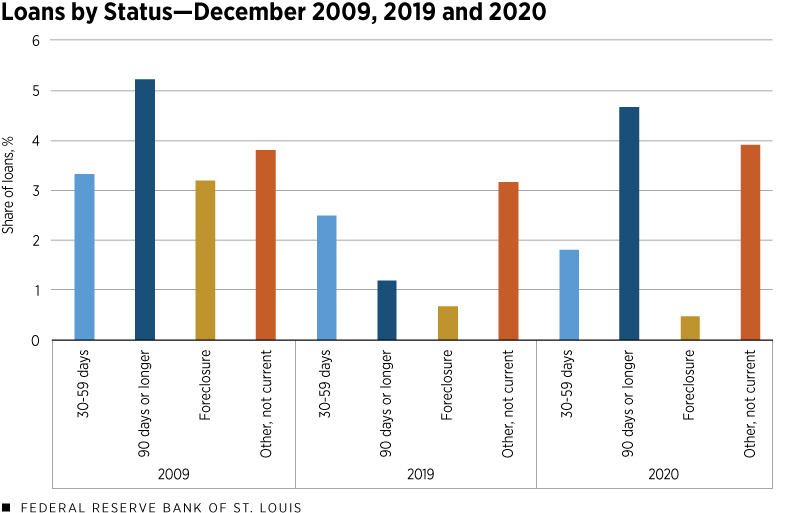
To obtain information on approximately two-thirds of the U.S. mortgage market, we used a loan-level data set from Black Knight (McDash). The second figure shows the December breakdown of noncurrent loans by status for three different periods: 2009, which represents the peak of nonpayment during the Great Recession; 2019, which represents the pre-pandemic situation; and finally 2020 to capture the COVID-19 pandemic. Note that noncurrent loans can result in one of these four situations:
- Thirty to 59 days late
- Ninety days late or longer
- Foreclosure
- Other [includes 60 to 89 days late, paid off, real-estate ownedReal-estate owned, or REO, describes a class of property owned by a lender—typically a bank, government agency or government loan insurer—after an unsuccessful sale at a foreclosure auction. (REO) and involuntary liquidation and servicing transfers, meaning a change in loan servicer]
There are two key messages from the second figure. First, the severe delinquency rate (90 days late or longer) in December 2020 was much higher than in the previous year—4.7% of all loans—and only about half a percentage point lower than in 2009. Second, mildly late (30 to 59 days with no payment) and foreclosures were much lower in December 2020 than in December 2009.
Note that the mildly late status is lower in 2020 than in 2019; this is because the surge in this nonpayment status occurred earlier in the year for 2020. To understand these differences, we focused on what happened to loans that didn’t receive payments for three months during the pandemic and compared them to how things evolved during the financial crisis.
What Happened to Noncurrent Loans?
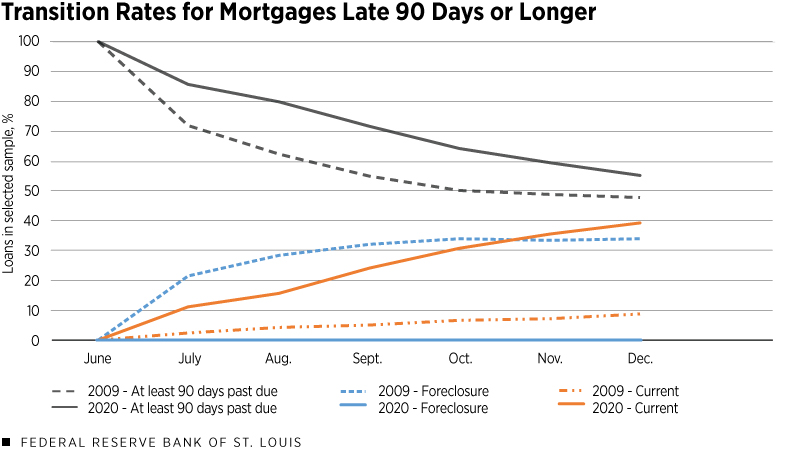
To answer this question, we selected a subset of mortgages. In particular, we looked at loans that were current in February 2020 and became 90 or more days delinquent in June, and analyzed what happened to these loans in the following months. (See the third figure.)
February 2020 was chosen because it was the month before the COVID-19 pandemic shutdowns and the economic downturn began in the U.S. June was selected because it was the first month in which a large share of the loans that were current in February reached at least 90 days late—2.8% of the current loans in February 2020 were 90 or more days late by June 2020. To compare with the financial crisis, we did the same for 2009. In this case, approximately 0.7% of the current loans in February 2009 were 90 days late or longer in June 2009.For robustness, we also checked this for 2008 and found similar numbers.
First, consider the gray lines, which start at 100% in June. They show the share of sampled loans that remained 90 days late or longer in the month of reference. The dashed line, which represents 2009, shows that approximately 48% of mortgage loans remained at least 90 days late by the end of 2009.
In contrast, the solid gray line* shows that about 55% of these loans remained 90 days late or longer at the end of 2020. Thus, there is not such a large difference between the COVID-19 pandemic and the financial crisis in terms of loans leaving the status of being at least 90 days late.
But, what happened to the loans that exited the status of being 90 days late or longer? These loans could have gone to:
- Current status
- Foreclosure
- Other (which includes going back to being more than 30 or 60 days late; REO; involuntary liquidation; or servicing transferred or repaid, which includes loans fully repaid either because the house was sold or the loan was refinanced)
The answer is very different for 2009 and 2020, and the main differences are in the current and foreclosure statuses. The first difference can be seen in the loans that transition to the current status (orange lines).
In 2020, about 40% of the loans 90 days late or longer in June ended the year being current, around four times the 2009 level. The second difference is in the incidence of foreclosure. The blue lines show the loans 90 days late or longer in June that transitioned to foreclosure. For 2009, the dashed line shows that this share increased and reached 34% in December.
In contrast, the solid blue line stays very close to zero, indicating that few loans transitioned to foreclosure in 2020. Thus, the main difference is that in 2009, a significant share of loans leaving the 90-days-late-or-longer status transitioned to foreclosure, while in 2020, as the economy recovered, these loans transitioned back to current status.
How the CARES Act Helped Borrowers
On March 27, 2020, Section 4022 of the Coronavirus Aid, Relief, and Economic Security (CARES) Act introduced provisions to suspend foreclosures and offered options for forbearance on federally backed mortgages. (Note that some private lenders also have forbearance programs.) These mortgage loans comprise a sizeable market share and include loans from or through the following:See Section 4022(a)(2) of the CARES Act.
- Federal Housing Administration (FHA)
- National Housing Act (NHA) Mortgage-Backed Securities Program
- Veterans Administration (VA)
- Department of Agriculture (USDA)
- Fannie Mae
- Freddie Mac
The suspension of foreclosures does not apply to vacant or abandoned properties and, although it initially lasted 60 days, the suspension was extended and is now set to expire June 30, 2021. The section also mandates that borrowers of any delinquency status have the right to forbearance if the COVID-19 pandemic has directly or indirectly caused financial hardship.Borrowers could enter forbearance for 180 days with an option to shorten the term or extend up to an additional 180 days. Note: This applies only to mortgages for one- to four-unit properties. Larger multifamily properties have different rules dictated under Section 4023.
Once forbearance ends, borrowers can make a lump-sum payment for the amount of principal and interest missed during forbearance. They also can:
- Extend the length of the mortgage to continue making the same monthly payment amounts
- Agree to pay the lump sum of missed payments at the end of the mortgage term or at the time of sale or refinance
- Spread out the sum of missed payments over time, on top of the regular monthly payment
- Pursue loan modification, such as reducing the interest rate, changing the length of the loan or modifying the monthly payment amount
These forbearance possibilities were not as easily available during the financial crisis and contributed to the rise in foreclosures between 2007 and 2009. At that time, Congress encouraged lenders to use HOPE for Homeowners, a loan modification program passed as part of the Housing and Economic Recovery Act in 2008. However, the requirements for homeowners seeking assistance through this program were more stringent than those for the recent CARES Act assistance.Homeowners had to meet the following requirements: (1) The home was their primary residence and they had no ownership interest in any other residential property such as a second home; (2) their existing mortgage was originated on or before Jan. 1, 2008, and they made at least six payments; (3) they were not able to pay their existing mortgage without help; (4) their total monthly mortgage payments due were more than 31% of their gross monthly income; (5) and they certified that they had not been convicted of fraud in the past 10 years, intentionally defaulted on debts, and did not knowingly or willingly provide material false information to obtain the existing mortgage(s). See Hope for Homeowners for more details. Additionally, the loan modification agreement required that homeowners share with the FHA any equity made from selling or refinancing their homes.
A Stronger Housing Market Today
A strong housing market—a key factor that was not present during the 2007-08 financial crisis—allows troubled borrowers to sell their homes upon exiting forbearance and pay in full rather than foreclose. A January 2021 report from Black Knight Inc. found that about nine in 10 loans in forbearance have at least 10% equity, the amount generally needed to sell at the end of forbearance rather than foreclose.
In 2009, typical home values decreased about 2% from June to December. In contrast, typical home values increased approximately 5% from June 2020 to December 2020. The need to spend more time at home during the pandemic created a surge in housing demand and pushed home prices to rise. Higher home values mean more equity and therefore lower risk of foreclosure.
In addition to higher home values, the pools of borrowers and loans were also lower risk when the COVID-19 pandemic hit the U.S. In 2009, approximately 7% of the loans in our data were made to subprime borrowers (those considered a higher credit risk) compared to about 3.5% in 2020. And the share of adjustable rate mortgages has fallen about 10 percentage points since the financial crisis. Adjustable rate mortgages generally have low introductory interest rates that increase after a certain period. When the interest rate increases, the monthly payment also increases, leading to higher risk of nonpayment.
Another difference between the two periods is that the U.S. economy was still in decline in the second half of 2009. In contrast, the 2020 U.S. economy was beginning to recover by June. The unemployment rate increased from 9.5% to 9.9% between June and December 2009 but decreased from 11.1% to 6.7% between June and December 2020.
Interaction between the CARES Act and the Housing Market
Note, finally, that house prices are probably also related to the actions to facilitate forbearance in the CARES Act. Early and thorough government action has given borrowers the chance to become current on mortgage loans rather than foreclosing.
Economists Elliot Anenberg and Tess Scharlemann at the Federal Reserve Board of Governors explained in a March 2021 article that allowing people to stay in their homes, rather than selling, avoids a price spiral by stabilizing the supply of houses on the market. This kind of forbearance correlates positively with unemployment and negatively with new home listings.
Furthermore, the economists found that the average share of mortgages in forbearance increased by 4.7 percentage points between May and July 2020, relative to just before the COVID-19 pandemic—indicating that homeowners were using these forbearance programs.
Conclusion
Although the evolution of the share of current mortgages during the COVID-19 pandemic resembles what happened around the time of the financial crisis, there are important differences between these two episodes. The clearest fact that distinguishes the two is the lack of a spike in foreclosures during the COVID-19 pandemic that was likely helped by the CARES Act and a stronger housing market.
* This article has been updated to correct the description of the line’s color and pattern.
Endnotes
- The global financial crisis lasted from 2007 to 2008. The resulting Great Recession officially lasted until mid-2009.
- Real-estate owned, or REO, describes a class of property owned by a lender—typically a bank, government agency or government loan insurer—after an unsuccessful sale at a foreclosure auction.
- For robustness, we also checked this for 2008 and found similar numbers.
- See Section 4022(a)(2) of the CARES Act.
- Borrowers could enter forbearance for 180 days with an option to shorten the term or extend up to an additional 180 days. Note: This applies only to mortgages for one- to four-unit properties. Larger multifamily properties have different rules dictated under Section 4023.
- Homeowners had to meet the following requirements: (1) The home was their primary residence and they had no ownership interest in any other residential property such as a second home; (2) their existing mortgage was originated on or before Jan. 1, 2008, and they made at least six payments; (3) they were not able to pay their existing mortgage without help; (4) their total monthly mortgage payments due were more than 31% of their gross monthly income; (5) and they certified that they had not been convicted of fraud in the past 10 years, intentionally defaulted on debts, and did not knowingly or willingly provide material false information to obtain the existing mortgage(s). See Hope for Homeowners for more details.
Views expressed in Regional Economist are not necessarily those of the St. Louis Fed or Federal Reserve System.
For the latest insights from our economists and other St. Louis Fed experts, visit On the Economy and subscribe.
Email Us


