


High Housing Valuations Move Inland
The U.S. housing bubble that peaked about 15 years ago was most pronounced in coastal regions (which I define as those with Pacific or Atlantic shorelines). Among the nation’s nine census divisions, three of the four with average house price-to-rent ratios above the national average at their respective peaks in 2005-07, the period that marked the peak of the housing boom, were located along the Pacific or Atlantic coasts: the Pacific, South Atlantic and New England divisions.For ease of exposition, I use the average house price-to-rent ratio and the term “housing valuation” interchangeably in this article. I explained why this ratio often serves as a measure of housing valuation in a previous post. As detailed in the appendix to this post, I use average house price-to-rent ratios across the nation in January 1991 as benchmarks against which subsequent ratios are compared, to evaluate changes in housing valuations. See the appendix for further details on how I estimated the house price-to-rent ratio, which is based on a home price index and a rent index. Among inland divisions, only the Mountain states experienced above-average house price-to-rent ratios, a measure of housing valuation, at that time.
In the current housing boom, three of the five divisions with average housing valuations above the national average are inland—namely, the Mountain, West North Central and West South Central divisions. Even more striking, average housing valuations in all five inland divisions are higher now relative to the national average than they were at the peak of the previous housing boom. Conversely, average housing valuations in all four coastal divisions are lower now relative to the national average than they were at the previous boom’s peak. Thus, compared to last time, the housing boom has moved inland.
Housing Valuations Were High in Most Coastal Areas during the Housing Boom
One approach economists use to judge housing valuations is to compare house prices to a measure of housing’s “fundamental value,” which is based on the housing services it provides. For owner-occupied housing, housing services are proxied by an estimate of the rent that a particular house would command if it were rented to someone else, rather than being occupied by the owner. The Bureau of Labor Statistics (BLS) estimates “imputed rent” for owner-occupied housing each month in a large number of metropolitan areas and for the nation’s entire housing stock. In practice, this involves observing rents paid for housing units that actually are being rented and then imputing this amount of rent to comparable owner-occupied houses. “Fair value” is the price at which the price-to-rent ratio approximates its historical average. For details on the data and calculations used in this post, see the appendix.
As the figure below shows, the Pacific, South Atlantic and New England divisions—what I term “coastal divisions”—all had average housing valuations above the national average at their respective peaks in the previous housing boom. The Middle Atlantic, the fourth coastal division, was an exception.
Meanwhile, with the exception of the Mountain division, all of the inland divisions—West North Central, East North Central, East South Central and West South Central—had average housing valuations below the national average at their respective peaks during the previous boom.
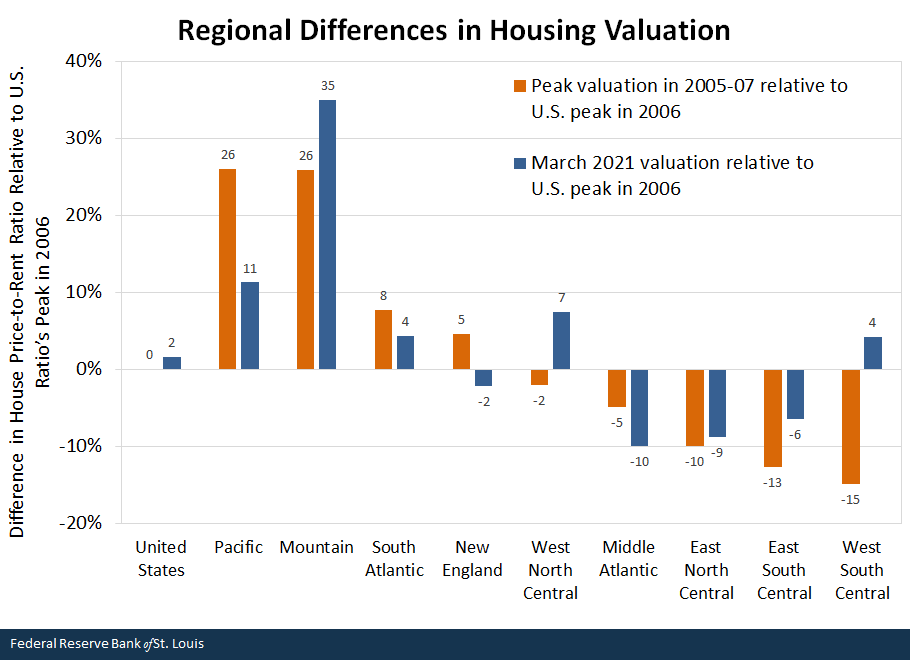
NOTES: The figure shows, in the orange bars, the percent difference between a census division’s average house price-to-rent ratio at its peak during the 2005-07 period and the peak national ratio, which occurred in January 2006. The blue bars show the percent difference between a census division’s average house price-to-rent ratio in March 2021 and the January 2006 national ratio.
SOURCES: Federal Housing Finance Agency, Bureau of Labor Statistics and author’s calculations.
Inland Areas Are More Likely to Have High Valuations Now
All nine census divisions were nearing or had reached an all-time peak in housing valuation in March 2021. The previous figure shows that average housing valuations in March 2021 were above the 2006 national peak in only two coastal divisions (Pacific and South Atlantic) but were above the peak in three inland divisions (Mountain, West North Central and West South Central). Thus, the current housing boom reflects relatively higher inland valuations than last time.
Inland Valuations Have Increased while Coastal Valuations Have Decreased since 2005-07
Another way to show how different the regional pattern of the current housing boom is from last time is to calculate how much average housing valuations have changed in each census division in the last 15 years. I do this by subtracting the housing valuation in March 2021 from the 2005-07 peak. (The value of the blue bar minus the value of the orange bar for the relevant region, as shown in the figure above.)
The figure below shows that the average house price-to-rent ratios in all five inland divisions currently exceed their own peaks in the 2005-07 period, while all four coastal valuations have decreased since then. The largest increase is in the West South Central division, which includes Texas; the greatest decrease is in the Pacific division, which includes California. Even after these big changes, however, the average housing valuation in the Pacific division remains higher than that in the West South Central division; as of March, the Pacific’s house price-to-rent ratio was 11% higher than the 2006 national peak, while West South Central’s ratio was only 4% higher. (See the first figures.)
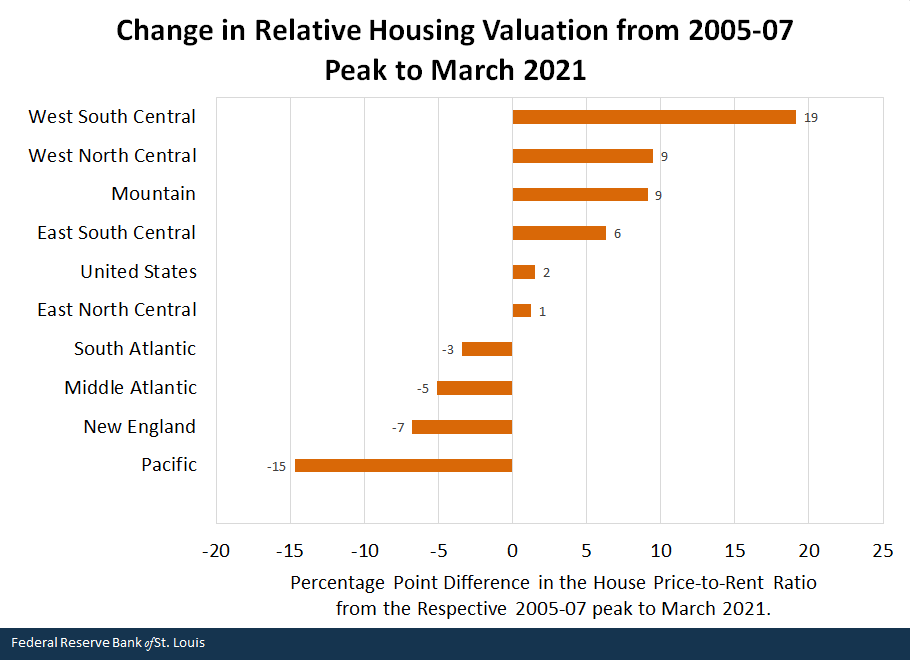
NOTES: The figure shows the difference between the orange and blue bars for each census division in the previous figure. These differences show how much the division’s average house price-to-rent ratio changed between its 2005-07 peak and March 2021, in percentage points.
SOURCES: Federal Housing Finance Agency, Bureau of Labor Statistics and author’s calculations.
The Great Inland Housing Boom
If I assume average house price-to-rent ratios in January 1991 approximated “fair value,” the current housing boom has lifted all nine census divisions significantly above their respective fair-value levels.See the appendix for a description of the fair value of housing. Using January 1991 as a benchmark period in which I assume all census divisions were priced at fair value, current average housing valuations exceed fair value as follows: U.S. overall, 42%; New England, 36%; Middle Atlantic, 26%; East North Central, 27%; West North Central, 50%; South Atlantic, 46%; East South Central, 31%; West South Central, 45%; Mountain, 88%; and Pacific, 55%. Moreover, the average U.S. housing valuation now exceeds its 2006 peak, albeit by a small amount.
The regional pattern of the current housing boom differs notably from the boom that peaked 15 years ago. Housing valuations in inland regions of the country have increased more than valuations in coastal census divisions, exceeding their peaks in the 2005-07 period. If housing markets in coastal regions join their counterparts inland in appreciating rapidly, the current housing boom could substantially exceed what was, at the time, considered a historic housing bubble.
Notes and References
- For ease of exposition, I use the average house price-to-rent ratio and the term “housing valuation” interchangeably in this article. I explained why this ratio often serves as a measure of housing valuation in a previous post. As detailed in the appendix to this post, I use average house price-to-rent ratios across the nation in January 1991 as benchmarks against which subsequent ratios are compared, to evaluate changes in housing valuations. See the appendix for further details on how I estimated the house price-to-rent ratio, which is based on a home price index and a rent index.
- See the appendix for a description of the fair value of housing. Using January 1991 as a benchmark period in which I assume all census divisions were priced at fair value, current average housing valuations exceed fair value as follows: U.S. overall, 42%; New England, 36%; Middle Atlantic, 26%; East North Central, 27%; West North Central, 50%; South Atlantic, 46%; East South Central, 31%; West South Central, 45%; Mountain, 88%; and Pacific, 55%.
Additional Resources
- On the Economy: House Prices Surpass Housing-Bubble Peak on One Key Measure of Value
- On the Economy: How Many Mortgage Foreclosures Is Forbearance Preventing?
Appendix
The house price index: The house price index I used was the monthly Federal Housing Finance Agency Purchase-Only House Price Index for the United States. This data series runs from January 1991 to March 2021. It is a repeat-sales index that uses data from only actual sales of existing homes—that is, appraised values (such as those used in a refinance transaction) are excluded because they can be unreliable estimates of market values. This is especially true when market-based house prices are changing rapidly.
The rent index: I used the owners’ equivalent rent of primary residence (OER) series, a subcomponent of the shelter index. The OER index is available only for the four census regions, so I used these as follows: (1) the New England and Middle Atlantic divisions use the Northeast region OER index; (2) the South Atlantic, East South Central and West South Central divisions use the South region OER index; (3) the East North Central and West North Central divisions use the Midwest region OER index; and (4) the Mountain and Pacific divisions use the West region OER index.
Fair value of housing: As described in my previous post, I define the fair value of housing as the price at which the house price-to-rent ratio approximates its historical average. In this article, I assume that prices were near fair value in each census division and in the U.S. overall in January 1991, when my data begin. Choosing a different reference period or specific level of fair value would change the numbers described in this article but would not change the qualitative conclusions I draw from movements in house price-to-rent ratios over time.

Citation
William R. Emmons, ldquoHigh Housing Valuations Move Inland,rdquo St. Louis Fed On the Economy, June 21, 2021.
This blog offers commentary, analysis and data from our economists and experts. Views expressed are not necessarily those of the St. Louis Fed or Federal Reserve System.
Email Us
All other blog-related questions