How Many Mortgage Foreclosures Is Forbearance Preventing?
KEY TAKEAWAYS
- About 2.2 million mortgage borrowers were seriously delinquent at the end of the third quarter and about 3.9 million borrowers were in a forbearance plan.
- Not all delinquent borrowers are in forbearance and not all borrowers in forbearance are delinquent, making it difficult to assess the current state of mortgage distress.
- I estimate that about 500,000 borrowers will avoid foreclosure during the fourth quarter of 2020 due to forbearance.
- It is too soon to know how many of these foreclosures will be permanently avoided and how many have merely been postponed.

The COVID-19 shock resulted in the combined loss of more than 22 million jobs in March and April of this year; about 12 million jobs have since been added back. Prompt and aggressive monetary policy and fiscal policy responses prevented the downturn from being even worse.
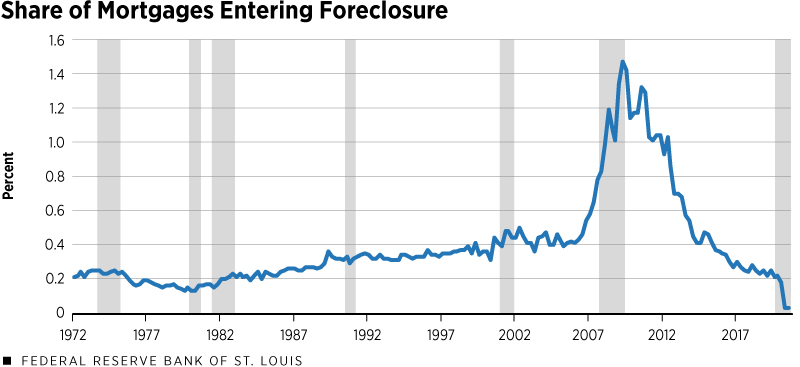
In stark contrast to the Great Recession, mortgage foreclosures have declined significantly in the early months of this recession. (See Figure 1.) This is due in part to broad-based policies like the Federal Reserve’s interest rate cuts and federal income-support payments that allowed many borrowers to continue making mortgage and other payments even after suffering a job loss. Mortgage forbearance programs also may have helped. These programs were instituted in advance of elevated mortgage distress this time rather than, as during the Great Recession, after it already had appeared.For information on current forbearance programs, see the Consumer Financial Protection Bureau. Certain programs require borrowers to request forbearance by Dec. 31, 2020. Some protections are available for renters, too. For information on government mortgage-relief efforts during and after the financial crisis and Great Recession, see the U.S. Treasury.

SOURCE: Mortgage Bankers Association.
NOTES: The data are the share of existing first-lien mortgages entering the foreclosure process each quarter. The data begin in the first quarter of 1972 and run through the third quarter of 2020.
DESCRIPTION: The share of mortgages entering foreclosure usually increases around recessions. This was particularly true around the Great Recession of 2007-09. More than 11 million mortgages entered the foreclosure process between 2008 and 2012. At the peak in the second quarter of 2009, 1.47% of existing mortgages entered foreclosure. In contrast, the share of mortgages entering foreclosure was only 0.03% in both the second and third quarters of 2020, the lowest rates ever recorded by the MBA.
It’s too soon to know how many mortgage foreclosures will occur after forbearance ends. To gauge the early impact of foreclosure moratoriums, this article combines a measure of serious mortgage delinquency—regardless of whether the borrower is in a forbearance plan—with historical relationships between serious-delinquency rates and subsequent initiations of foreclosure procedures. The result is an estimate of how many foreclosures current forbearance programs might be preventing—at least for now.
I considered several different historical periods to estimate the likelihood that a seriously delinquent mortgage will enter foreclosure during the following quarter. Based on that, I estimate that current forbearance programs may prevent about 500,000 foreclosures that otherwise would have occurred during the fourth quarter of 2020. This represents a 98% reduction in foreclosure activity compared with the level one would expect based on the current reported level of serious mortgage delinquency and a plausible estimate of the transition rate into foreclosure in the absence of forbearance.
Housing Distress Is Up, Foreclosures Are Down
This article discusses three different measures related to mortgage distress:
- Serious delinquency, defined as a borrower having made no payment in at least 90 days
- Forbearance, which is a temporary suspension of payment obligations that does not reduce the amount of money owed
- Foreclosure, which is a legal process in which a lender sues the borrower to obtain title to the mortgaged property (or otherwise provides legal notice of intent to seize the property in states that allow nonjudicial foreclosures).
As of the end of the third quarter of 2020, the Mortgage Bankers Association (MBA) reported the following distress statistics: These numbers are based on the MBA’s National Delinquency Survey press release for the third quarter of 2020 and MBA data accessed via Haver Analytics. The MBA asks survey respondents to report delinquency data regardless of whether the borrower is in a forbearance plan. The MBA reports delinquencies and foreclosures in percentage terms. To obtain volume estimates, I first multiplied the MBA’s reported share of mortgages in serious delinquency and the initial stage of foreclosure, respectively, by the reported number of mortgages serviced (39,745,960). I then adjusted for the MBA survey’s incomplete coverage by multiplying each estimate by 1.1561, which corresponds to the midpoint of the 85% to 88% coverage range estimated by the MBA. See the MBA’s FAQs document for more details.
- About 2.2 million mortgage borrowers were seriously delinquent (4.8% of borrowers).
- About 3.9 million homeowners were in forbearance plans (8.6% of borrowers).
- About 271,000 mortgages had received foreclosure notices during the quarter (0.6% of borrowers).
Confusingly, a seriously delinquent borrower may or may not be in a forbearance plan; meanwhile, a borrower in forbearance may or may not be seriously delinquent or, indeed, delinquent at all. And foreclosure procedures may be initiated or continued for mortgages not in forbearance even while many other borrowers are protected by a forbearance plan.
About one in six mortgage loans in forbearance recently was current in its payments.This figure was cited in a speech by Federal Reserve Governor Michelle W. Bowman, “The Changing Structure of Mortgage Markets and Financial Stability,” Nov. 19, 2020. She referenced the Mortgage Bankers Association’s Weekly Forbearance and Call Volume Survey of Nov. 9, 2020. Why would a borrower who can afford to pay choose forbearance, particularly if this might negatively affect one’s credit score? According to Moody’s, the credit-analysis firm, “Some borrowers have opted to enter a forbearance program as a precautionary safeguard, and continue to make their loan payments while in forbearance, but most borrowers in forbearance have not.”See Moody’s Credit Outlook, “ US banks' loan payment deferrals continue to mask deteriorating asset quality,” Nov. 19, 2020.
Historical Relationship between Delinquency and Foreclosure
The first step in estimating how many foreclosures that current forbearance plans may be preventing is to gauge how likely a seriously delinquent mortgage is to enter foreclosure in the absence of widespread forbearance. This “transition rate” has varied over time and by mortgage type.
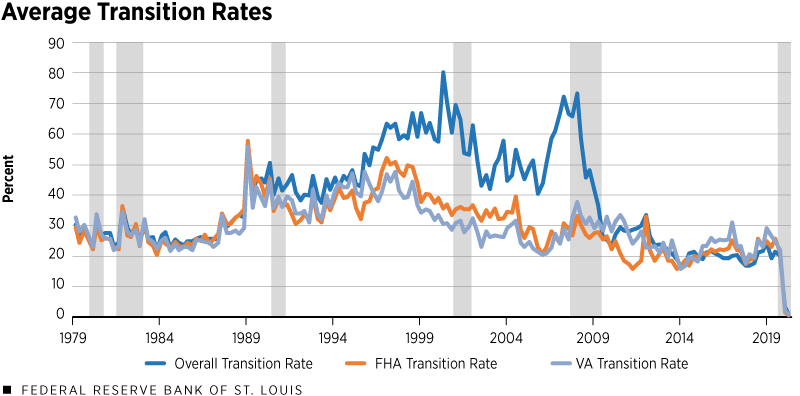
Figure 2 displays the number of foreclosure initiations in a given quarter divided by the number of mortgages that were classified as seriously delinquent in the reported quarter. The transition rate has varied over time and between mortgage types, so it’s not obvious what rate is “normal.”

SOURCES: Mortgage Bankers Association and author’s calculations.
NOTES: The data are the ratios of the number of foreclosure initiations in the next quarter (quarter t+1) to the number of seriously delinquent mortgages in the reported quarter (quarter t), shown for three different mortgage categories. For example, the transition rate for the first quarter of 1979 is the number of foreclosure initiations in the second quarter of 1979 divided by the number of mortgages seriously delinquent in the first quarter of 1979.The categories are all mortgages, mortgages insured by the Federal Housing Administration (FHA) and mortgages guaranteed by the Veterans Administration (VA). The data begin in the first quarter of 1979 (corresponding to serious delinquency in the first quarter and foreclosure initiation in the second quarter) and run through the second quarter of 2020 (corresponding to serious delinquency in the second quarter and foreclosure initiation in the third quarter).
DESCRIPTION: The ratio of foreclosure initiations in the next quarter to seriously delinquent mortgages in the reported quarter—the transition rate—varied significantly over time and, for a period of time, between mortgage types. From 1979 to 1988, the transition rate fluctuated between 20% and 36% for all mortgage types. From 1989 to 2008, the rate varied between 20% and 80%. The transition rates for FHA and VA mortgages were typically lower than for all mortgages throughout this period, with the gap especially large between 1995 and 2008. The 1995-2008 period included a large increase and subsequent decrease in the number of so-called conventional nonconforming mortgages, which aren’t backed by the federal government and aren’t eligible for purchase by a government-sponsored enterprise like Fannie Mae; these mortgages include subprime loans. During the 1995-2008 period, the foreclosure transition rate was notably higher on conventional nonconforming loans than on government-guaranteed (FHA and VA) or conforming (purchased by a GSE) loans, lifting the overall rate. Finally, the transition rate generally was between 15% and 30% between 2009 and 2019 for all types of mortgages. By the end of the period shown here, the transition rate dropped to 0.8% for all mortgage types.
Table 1 shows transition rates for three categories of mortgages—all mortgages, Federal Housing Administration (FHA) mortgages alone and Veterans Administration (VA) mortgages alone—and three time periods—1979-2019, 1989-2008 and 2009-19.
| Average Transition Rates (New Foreclosures Next Quarter as Percentage of Seriously Delinquent Mortgages in Reported Quarter) |
|||
|---|---|---|---|
| 1979-2019 | 1989-2008 | 2009-2019 | |
| All Mortgages | 38.5% | 52.6% | 23.2% |
| FHA Mortgages | 30.0% | 36.3% | 21.4% |
| VA Mortgages | 29.7% | 34.4% | 24.5% |
| SOURCES: Mortgage Bankers Association and author’s calculations. | |||
| NOTE: See the notes and description under Figure 2. | |||
Given the large increase and subsequent decrease in the number of conventional nonconforming mortgages during the 1989-2008 period, I view this period as anomalous. Instead, I use the transition rates estimated during the 2009-19 period in my estimation of prevented foreclosures by mortgage type. For the entire universe of mortgage loans, that rate was 23.2%, as shown in Table 1.See the notes and description under Figure 2 for more information on mortgage types and a discussion of the changing transition rate.
New Foreclosures in the Fourth Quarter
To estimate what will happen in the fourth quarter of 2020, I apply the foreclosure-initiation rates observed in both the second and third quarters of 2020—0.03%—to the fourth quarter. This means I am assuming the effects of forbearance on foreclosures observed so far in 2020 will continue. This results in a forecast of just under 12,000 new foreclosures among all 46 million mortgages outstanding.
The next step is to apply transition rates for each time period and mortgage type to serious delinquency rates reported by the MBA for the third quarter of 2020 to estimate the number of foreclosure initiations that would occur in the absence of forbearance. This method suggests about 509,000 foreclosures would be initiated in the absence of forbearance (using the 2009-19 transition rate).
Table 2 reports the difference between estimated foreclosure initiations in the fourth quarter and the projected number of foreclosure initiations one would have expected, given the rate of serious delinquency in the third quarter and various assumptions about transition rates.
| Estimated 2020:Q4 Foreclosure Initiations Not Occurring under Various Assumed Transition Rates | |||
|---|---|---|---|
| 1979-2019 | 1989-2008 | 2009-2019 | |
| All Mortgages | 824,616 | 1,142,671 | 497,173 |
| FHA Mortgages | 215,312 | 264,458 | 155,304 |
| VA Mortgages | 48,346 | 56,620 | 40,171 |
| SOURCES: Mortgage Bankers Association and author’s calculations. | |||
| NOTE: See the notes and description under Figure 2. | |||
Using the 2009-19 transition rate, I estimate that about 497,000 foreclosure initiations will have been prevented in the fourth quarter due to forbearance plans, a reduction of almost 98% compared to what they would have been without forbearance. (See Table 3.) If I had used transition rates either from the entire sample period or from the 1989-2008 period alone, my estimate of prevented foreclosures would have been significantly higher. But that would not be appropriate because many fewer subprime and other nontraditional mortgages—which were much more likely to transition into foreclosure—exist today than in the earlier period.
| Predicted Reduction in 2020:Q4 Foreclosure Initiations under Various Assumed Transition Rates | |||
|---|---|---|---|
| 1979-2019 | 1989-2008 | 2009-2019 | |
| All Mortgages | 98.6% | 99.0% | 97.7% |
| FHA Mortgages | 99.1% | 99.3% | 98.8% |
| VA Mortgages | 98.3% | 98.6% | 98.0% |
| SOURCES: Mortgage Bankers Association and author’s calculations. | |||
| NOTE: See the notes and description under Figure 2. | |||
Foreclosures Avoided or Merely Postponed?
This simple exercise in estimating the number of new foreclosures that forbearance plans may prevent during the fourth quarter of 2020 tells us very little about future mortgage distress and foreclosure activity. A large literature in economics that emerged after the Great Recession investigates policies that might reduce the transition from mortgage distress into foreclosure.For example, see Peter Ganong and Pascal Noel, “Liquidity versus Wealth in Household Debt Obligations: Evidence from Housing Policy in the Great Recession,” American Economic Review, 2020, Vol. 110, No. 10, pp. 3100-38. One conclusion of this literature is that designing effective policies is very difficult. One thing is clear: Forbearance is not a permanent solution to mortgage distress. Instead, forbearance merely buys time for other actions and policies to be undertaken.
Endnotes
- For information on current forbearance programs, see the Consumer Financial Protection Bureau. Certain programs require borrowers to request forbearance by Dec. 31, 2020. Some protections are available for renters, too. For information on government mortgage-relief efforts during and after the financial crisis and Great Recession, see the U.S. Treasury.
- These numbers are based on the MBA’s National Delinquency Survey press release for the third quarter of 2020 and MBA data accessed via Haver Analytics. The MBA asks survey respondents to report delinquency data regardless of whether the borrower is in a forbearance plan. The MBA reports delinquencies and foreclosures in percentage terms. To obtain volume estimates, I first multiplied the MBA’s reported share of mortgages in serious delinquency and the initial stage of foreclosure, respectively, by the reported number of mortgages serviced (39,745,960). I then adjusted for the MBA survey’s incomplete coverage by multiplying each estimate by 1.1561, which corresponds to the midpoint of the 85% to 88% coverage range estimated by the MBA. See the MBA’s FAQs document for more details.
- This figure was cited in a speech by Federal Reserve Governor Michelle W. Bowman, “The Changing Structure of Mortgage Markets and Financial Stability,” Nov. 19, 2020. She referenced the Mortgage Bankers Association’s Weekly Forbearance and Call Volume Survey of Nov. 9, 2020.
- See Moody’s Credit Outlook, “ US banks' loan payment deferrals continue to mask deteriorating asset quality,” Nov. 19, 2020.
- See the notes and description under Figure 2 for more information on mortgage types and a discussion of the changing transition rate.
- For example, see Peter Ganong and Pascal Noel, “Liquidity versus Wealth in Household Debt Obligations: Evidence from Housing Policy in the Great Recession,” American Economic Review, 2020, Vol. 110, No. 10, pp. 3100-38.
This article originally appeared in our Housing Market Perspectives publication.
Citation
William R. Emmons, ldquoHow Many Mortgage Foreclosures Is Forbearance Preventing?,rdquo St. Louis Fed On the Economy, Dec. 18, 2020.
This blog offers commentary, analysis and data from our economists and experts. Views expressed are not necessarily those of the St. Louis Fed or Federal Reserve System.
Email Us
All other blog-related questions


