How Income Volatility Affects Food Volatility
Income volatility often has negative consequences for families, especially for those with children. Children living in households with unstable incomes are more likely to experience behavioral problems, reduced earnings, and income instability later in life.
How well can households insure themselves against fluctuations in income? If families are able to predict these fluctuations and have full access to credit markets, they should be able to smooth their consumption over time, and income fluctuations should not impact a family’s ability to purchase necessary goods and services.
In this blog post, we explore the relationship between income instability and instability in food consumption for families with and without children. We found that as income volatility increases, food volatility increases faster for families with children than for families without children. This suggests that families with children are less able to smooth their consumption than those without children. It may be the differences in consumption smoothing that drive the long-run negative impacts of income volatility on children.
We used data from the Panel Study of Income Dynamics (PSID). Using the PSID means that we can track families and their incomes, demographics, and food expenditures over time.Because of data limitations, we could not examine other categories of consumption, but food spending is one of the most basic and important.
Income Volatility and Food Spending
To track income volatility, we began by calculating each family’s five-year average of total income. Then, we calculated the five-year average of the squared deviation of log income from the mean. We replicated this transitory variance measure for a family’s spending on food.The transitory variance measure is found in Robert Moffitt and Sisi Zhang’s 2018 article in AEA Papers and Proceedings. Food expenditures include spending on groceries as well as delivery and restaurant meals.
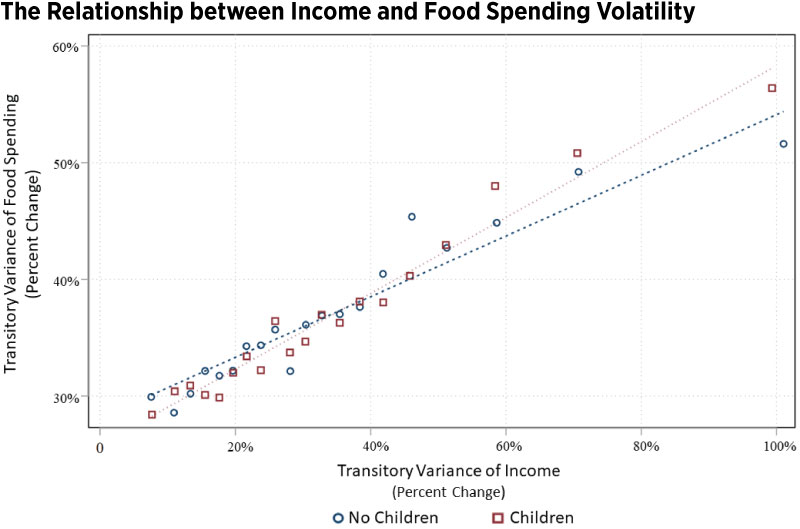
The figure below is a binned scatterplot that displays the relationship between the transitory variance of income volatility and the transitory variance of food volatility for families with children and for those without children. To create the scatterplot, we divided the income volatility data into equal-sized groups, or bins. Then, the average of income volatility and the average of food volatility in each bin were both calculated and placed on the plot. Finally, a line of best fit through the points shows the relationship between the two types of volatility.

NOTES: The transitory variance are the squared deviation from the mean value of either log income or log food spending. For example, a transitory variance in income of 20% means that income fluctuates an average of 20% over a five-year period. The dashed line represents the relationship of the two variables for families without children and the dotted line represents the relationship for families with children.
SOURCES: Panel Study of Income Dynamics and authors’ calculations.
Looking at the figure, the relationship is clear: the more volatile a family’s income, the more volatile their food spending. However, when the data are divided into families with children and families without children, the relationship between the two variables changes.
Both relationships between food volatility and income volatility are linear, but the slope of the line is steeper for families with children. (See the dotted line in the figure.) Thus, when families with children experience higher income volatility, there is a larger impact on food consumption and overall family well-being. In contrast, families without children see slightly higher food volatility with lower overall income volatility but lower food volatility with higher overall income volatility. (See the dashed line.)
Conclusion
Income volatility for families with children has a larger negative effect on food spending than income volatility for families without children. As family income volatility increases, more families have less stable access to food. Recently enacted policy proposals, such as the increased and restructured federal child tax credit, are designed to decrease childhood income instability, but the changes are, as of now, temporary.
Notes and References
- Because of data limitations, we could not examine other categories of consumption, but food spending is one of the most basic and important.
- The transitory variance measure is found in Robert Moffitt and Sisi Zhang’s 2018 article in AEA Papers and Proceedings.
Additional Resources
- Economic Synopses: Childhood Income Volatility
- On the Economy: More Households Face Food Insecurity during COVID-19
Citation
Hannah Rubinton and Maggie Isaacson, ldquoHow Income Volatility Affects Food Volatility,rdquo St. Louis Fed On the Economy, July 27, 2021.
This blog offers commentary, analysis and data from our economists and experts. Views expressed are not necessarily those of the St. Louis Fed or Federal Reserve System.
Email Us
All other blog-related questions


