More Irrational Exuberance? A Look at Stock Prices
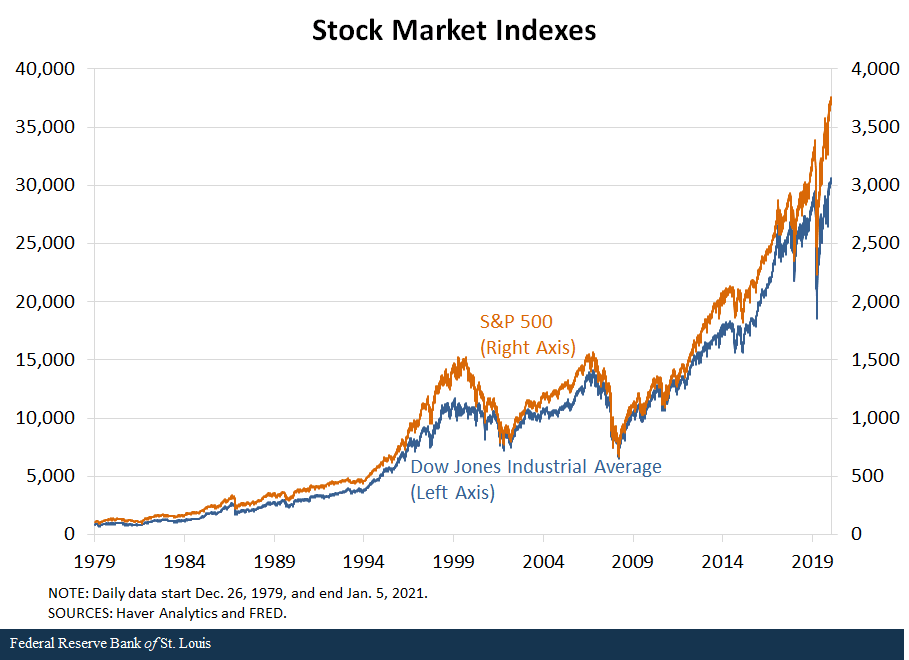
After a huge decline during the 2007-09 financial crisis, stock prices have been soaring, particularly since their COVID-19-induced nadir in March 2020. The figure below shows that prices for the Dow Jones Industrial Average and S&P 500 have approximately doubled in the past seven years and tripled in 10 years, and these measures understate the total return because they ignore dividends.

Share Prices and Earnings
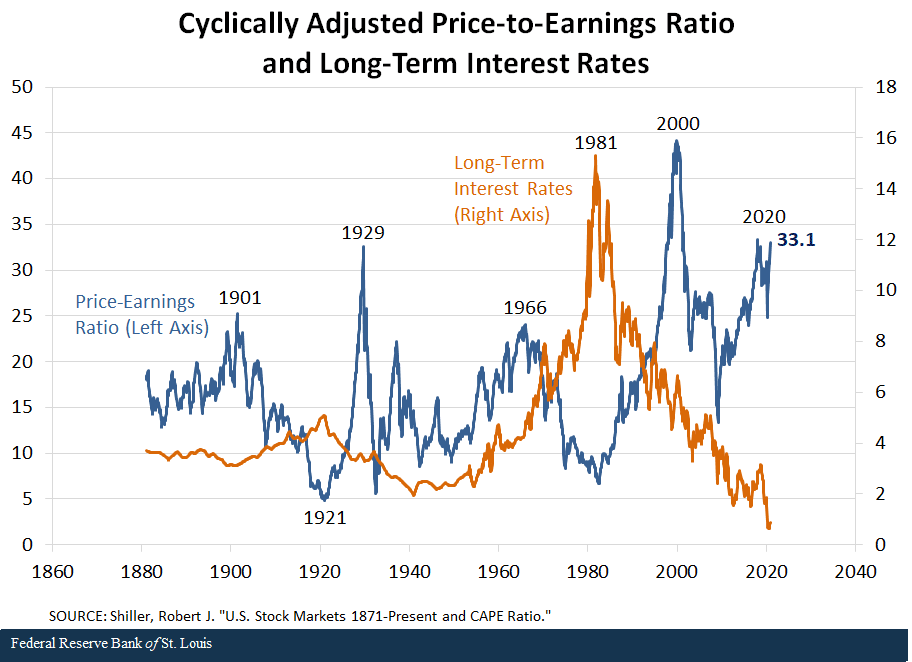
A share of stock is a claim on the income of a firm, so the price of a stock should reflect the expected risk-adjusted, discounted future earnings. The next figure illustrates a measure of stock prices adjusted for firm earnings; it presents economist Robert Shiller’s cyclically adjusted price-to-earnings (CAPE) ratio from the 1880s through the present.Shiller, Robert J. “U.S. Stock Markets 1871-Present and CAPE Ratio.” Online Data: Robert Shiller, 2020.

By adjusting stock prices for earnings and the state of the economy, this metric roughly shows the price of stocks compared with the fundamental value (i.e., earnings) of those stocks. Some would interpret the very high ratios in the figure to indicate that stocks are overvalued. The rightmost point shows that earnings-adjusted stock prices are very high by historical standards, reaching 33.1 in November.Much lower transactions costs provide one reason why today’s stock prices should be high compared with historical measures, but these effects are relatively small compared with the deviations in the second figure.
The figure adjusts stock prices for earnings, but we could also (equivalently) analyze the level of stock prices with respect to dividends and returns. A firm’s earnings can either be paid to shareholders as dividends or retained for internal investments, in which case the investments will increase the stock price and increase returns. So, for some purposes, it is useful to consider the level of stock prices adjusted for historical dividend growth and average returns.
The Gordon growth formula relates stock prices to the long-run behavior of returns and dividend growth. The formula starts with the definition of a stock return and then makes two simplifying assumptions: Expected dividend growth and expected returns are constant, and return-discounted stock prices converge to zero in the infinite future. Under these assumptions, the current price of a stock or stock index (Pt) is an increasing function of the rate of current dividends (Dt), expected dividend growth (g) and a decreasing function of expected stock returns (R).See Gordon, Myron. J.; and Shapiro, Eli. “Capital Equipment Analysis: The Required Rate of Profit.” Management Science, October 1956, Vol. 3, Issue 1, pp. 102-110; and Gordon, M. J. “Dividends, Earnings, and Stock Prices.” Review of Economics and Statistics, May 1959, Vol. 41, Issue 2, pp. 99-105. (The appendix explains this formula in detail.)
Pt = ((1 + g)Dt) / (R-g)
So, high stock prices today must be associated with some combination of high dividend growth and/or lower returns in the future. Which is more plausible?
Dividend growth is unlikely to be higher in the foreseeable future—even aside from the COVID-19 pandemic—because growth forecasts had been ratcheted down over the previous 10 years. For example, the Federal Open Market Committee’s (FOMC) public projections of long-run U.S. real gross domestic product (GDP) growth have declined from about 2.65% per annum in 2010 to 1.85% in September.
Therefore, it seems likely that stock returns will be lower in the future than they have been in the past. This doesn’t necessarily mean that stock prices will fall at any particular time, but returns over long horizons are likely to be significantly lower than the annual real (inflation-adjusted) stock returns that have averaged 8.6% since the 1870s and 7.8% since 1955.
Why Stock Values Matter
Asset prices that substantially exceed fundamental values often concern central bankers, because large negative returns caused by a price correction will create losses for some investors; the losses will tend to cause the affected investors to suddenly reduce their consumption and investment spending (i.e., a wealth effect).In 1996, then-Federal Reserve Chairman Alan Greenspan famously attributed high stock prices in Japan to “irrational exuberance,” and Robert Shiller used the phrase as the title of a book.
Lower stock prices will also make investing more expensive for firms that wish to finance investments by issuing stock, and it can affect the health of financial firms’ balance sheets, making borrowing more difficult. Sudden drops in asset prices can also create a flight to safe assets and a liquidity shortage that freezes up market functioning.
While the Fed does not try to prevent stock prices from declining, it must be concerned about liquidity shortages, market functioning and accompanying sudden shifts in economic activity to meet its price stability and maximum employment mandates. Therefore, when stock prices get very high compared to fundamentals, such as earnings, central bankers become concerned.
Appendix: The relation between stock prices, dividend growth and stock returns (PDF)
Notes and References
1 Shiller, Robert J. “U.S. Stock Markets 1871-Present and CAPE Ratio.” Online Data: Robert Shiller, 2020.
2 Much lower transactions costs provide one reason why today’s stock prices should be high compared with historical measures, but these effects are relatively small compared with the deviations in the second figure.
3 See Gordon, Myron. J.; and Shapiro, Eli. “Capital Equipment Analysis: The Required Rate of Profit.” Management Science, October 1956, Vol. 3, Issue 1, pp. 102-110; and Gordon, M. J. “Dividends, Earnings, and Stock Prices.” Review of Economics and Statistics, May 1959, Vol. 41, Issue 2, pp. 99-105.
4 In 1996, then-Federal Reserve Chairman Alan Greenspan famously attributed high stock prices in Japan to “irrational exuberance,” and Robert Shiller used the phrase as the title of a book.
Additional Resources
- On the Economy: How Financially Fit Are American Retirees?
- On the Economy: The St. Louis Fed's Financial Stress Index, Version 2.0
Citation
Christopher J. Neely, ldquoMore Irrational Exuberance? A Look at Stock Prices,rdquo St. Louis Fed On the Economy, Jan. 6, 2021.
This blog offers commentary, analysis and data from our economists and experts. Views expressed are not necessarily those of the St. Louis Fed or Federal Reserve System.
Email Us
All other blog-related questions


