


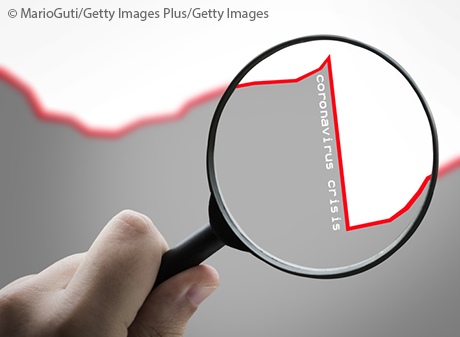
V-Shaped Recovery Eludes G-7 Countries
The COVID-19 pandemic led to a sharp global economic contraction in February 2020. After low points in March and April, economies around the world have started to recover with the help of monetary and fiscal stimulus.
Despite the growth in the last few months, a full recovery to a pre-pandemic economy may prove to be difficult. In a May post, Economist Yi Wen and Research Associate Brian Reinbold pointed out that a temporary drop in the growth of gross domestic product (GDP) is equivalent to a permanent drop in GDP levels; just returning the growth rate to its long-run trend is not enough. To prevent permanent impacts from the pandemic, the growth rate must overshoot its long-run trend to make up for the previous drop in growth. This requires aggressive monetary and fiscal policy.
Achieving a V-shaped recovery is important for macroeconomic indicators other than GDP growth. In this post, we examine whether a V-shaped recovery is in sight for G-7 countries based on industrial production, stock markets and employment.
Industrial Production Continues to Lag
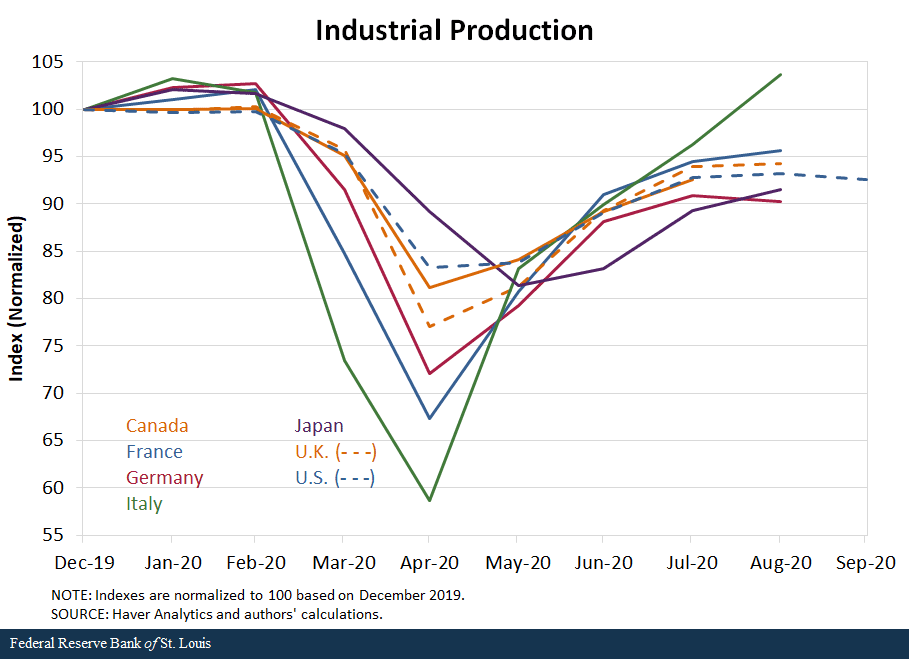
Industrial production, a measure of industrial sector output that includes mining, manufacturing and utilities, dropped steeply in March and April in all seven countries. Some drops were steeper than others. Italy’s industrial production reached its lowest point in April, when output dropped by 41.3 points, or 41.3%, from December 2019. At their lowest points, the drops were:
- 32.7% for France
- 27.9% for Germany
- 23.0% for the U.K.
- 18.8% for Canada
- 16.7% for the U.S.
In Japan, the lowest value for the index was a month later in May, when it fell 18.6% from the December value.
After reaching its low point, industrial production grew in all seven developed countries. In Italy, the industrial production index in August was even 3.6% higher than in December 2019. But growth in the other six countries seems to have tapered off before a full recovery had been achieved. In the U.S., for example, the September index was still 7.4% lower than the December level, and it had decreased by 0.6 points from August.
Mixed Equities
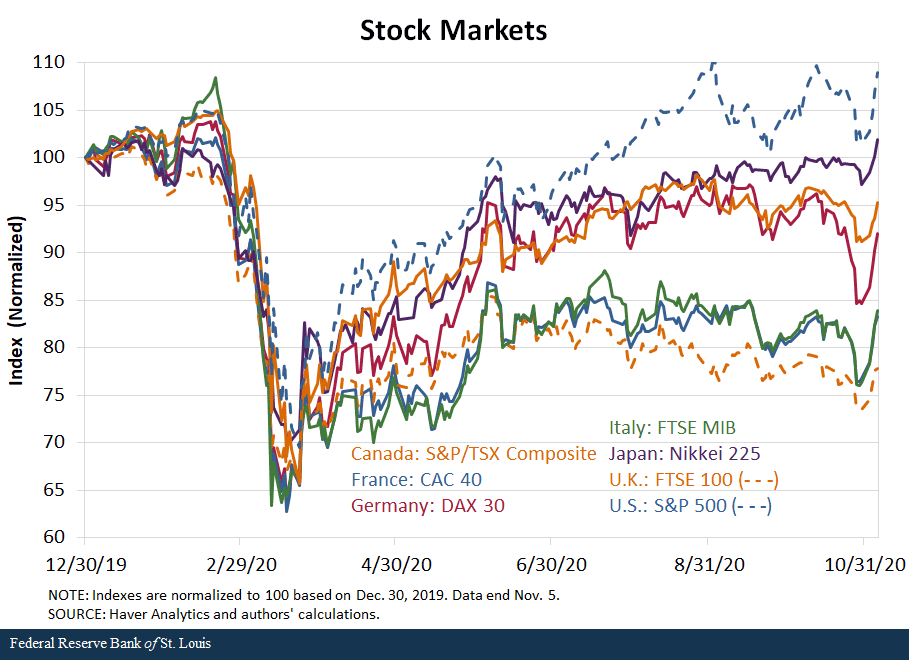
If we look at the financial market, it paints a similar picture. Major stock market indexes in the G-7 countries saw a steep drop in February and March. On March 23, 2020, the U.S. S&P 500 was down 30.5% from Dec. 30, 2019. As of that same day, Canada’s S&P/TSX Composite was down 34.3% points, Japan’s Nikkei 225 lost 28.6%, Italy’s FTSE MIB dropped 33.8%, and France’s CAC 40 fell 34.6%; Germany’s DAX 30 and the U.K.’s FTSE 100 both declined 34.2%.
Since March, stock market performance has improved in all countries. On Nov. 5, the S&P 500 and the Nikkei 225 were 9.0% and 1.9% higher, respectively, than their Dec. 30 levels. In France, the U.K. and Italy, stock markets were still down more than 16%. Stock markets in Canada and Germany were closer to a recovery, with declines of only 4.7% and 8.0%, respectively. The U.S. and Japanese stock markets are the only ones thus far with a full V-shaped recovery.
U.S. and Canada Lag in Jobs Rebound
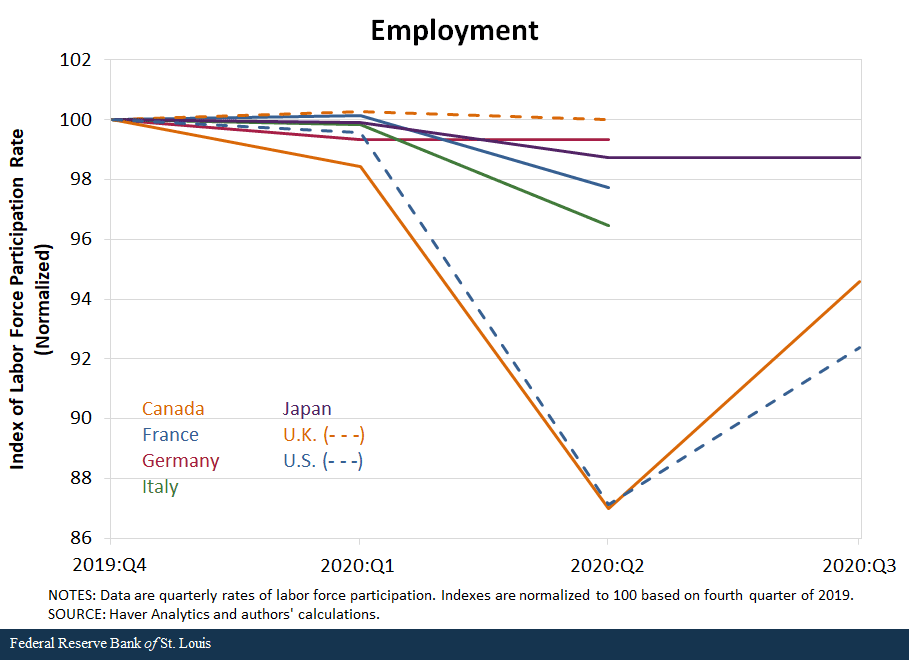
The labor market, however, paints a different picture. There was only a slight drop in employment (as measured by an index of the rate of labor force participation) in Europe and Japan; this is likely related to their large subsidization of employer-employee relationships. Employment in the U.S. and Canada dropped from the first quarter to the second quarter but started to rise again by the third quarter. Time will tell whether it will return to previous levels or slow in growth.
More Stimulus May Be Needed
Overall, industrial production in most countries was still 5% to 10% below full recovery, according to the latest available data. Stock markets were still below full recovery, except in the U.S. and Japan. Although employment in Europe and Japan has not dropped much, this may change when subsidies run out. U.S. and Canadian employment rates have yet to recover.
Further fiscal and monetary stimulus may be necessary to achieve a full V-shaped recovery in the economy. Importantly, monetary policy is necessary but not sufficient: It must be paired with aggressive fiscal stimulus to prevent permanent losses in real output and employment from the COVID-19 pandemic.
Additional Resources


Citation
Yi Wen and Iris Arbogast, ldquoV-Shaped Recovery Eludes G-7 Countries,rdquo St. Louis Fed On the Economy, Nov. 16, 2020.
This blog offers commentary, analysis and data from our economists and experts. Views expressed are not necessarily those of the St. Louis Fed or Federal Reserve System.
Email Us
All other blog-related questions