


How to Achieve a V-Shaped Recovery amid the COVID-19 Pandemic
The COVID-19 pandemic could result in an economic decline that rivals the Great Depression. The Federal Reserve has already set the federal funds rate to close to zero and commenced purchasing massive amounts of securities, and the U.S. government has sent out stimulus checks and implemented emergency lending programs totaling over $2 trillion to stimulate the economy.
There is no doubt that this fiscal and monetary stimulus is beneficial. However, it may still not be enough. The goal of effective policy should be more than just getting gross domestic product (GDP) growth back to trend. It should also include getting the GDP level back to trend, which may require additional stimulus.
Illustrating GDP Growth and Level
It is important to understand that a temporary drop in the growth rate of GDP implies a permanent drop in the level of GDP. This means that the economic damage from a severe recession can last indefinitely without powerful, overshooting responses from policy-engineered stimulus.
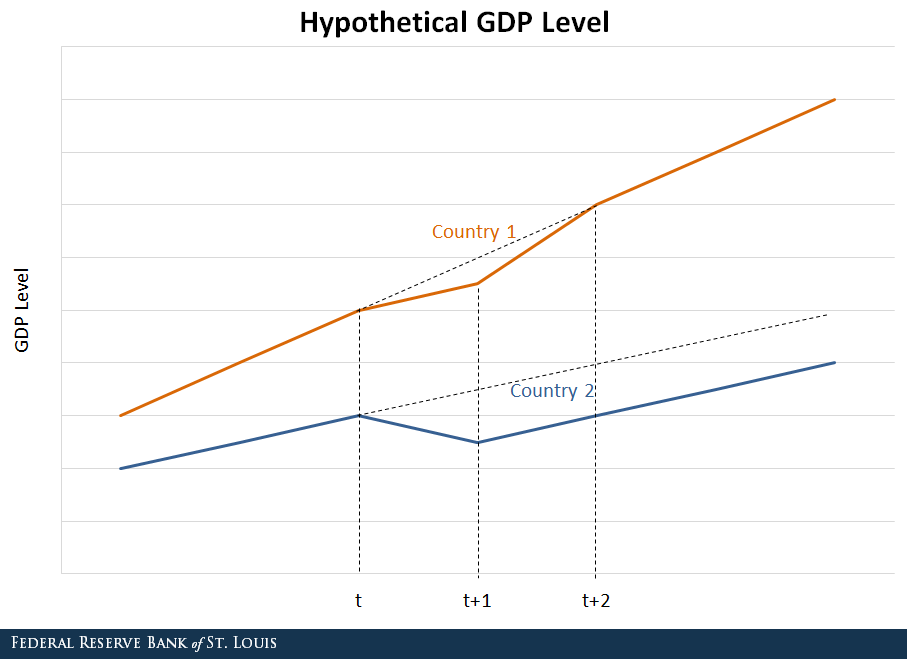
The figures below give a hypothetical example to make this point more clear. The first figure shows the hypothetical GDP level for two countries with different growth trends:
- Country 1 is growing at 10% per year.
- Country 2 is growing at 2% per year.
Both countries experience a temporary drop in growth starting at time t and a recovery starting at time t+1. At time t+2, Country 1’s GDP level is back to its long-run trend and achieves a V-shaped recovery, while Country 2’s GDP level only achieves an L-shaped recovery and thus runs a permanently lower GDP level parallel to its original trend.
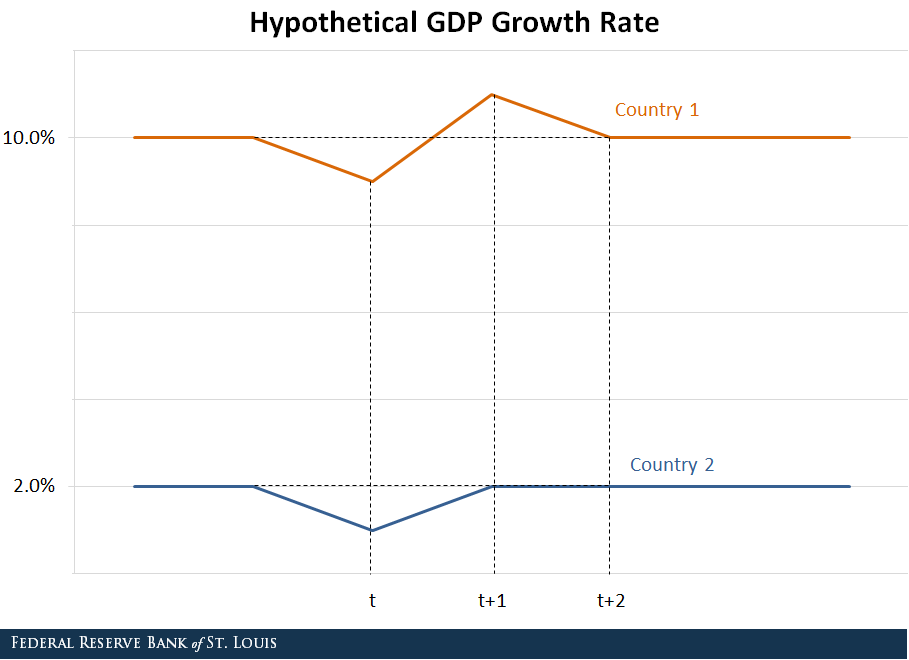
The second figure demonstrates what these different GDP level paths imply for growth rates. Clearly, Country 1’s long-run growth rate is significantly higher than Country 2’s before the decline, but this difference does not matter. The crucial reason for Country 1’s V-shaped recovery in GDP level is that its growth rate experiences an S-shaped recovery.
After the temporary drop in the growth rate at time t, Country 1 overshoots its long-run trend of 10% at time t+1 before returning to its 10% long-run trend growth rate at time t+2. This overshooting is critical for Country 1’s GDP level to return to its long-run trend: Previous lower growth needs to be completely offset by higher growth.
In sharp contrast, Country 2’s growth rate merely resumes its long-run rate at time t+1 after a temporary drop at time t without overshooting. Therefore, the permanent effect of a temporarily lower GDP growth rate for Country 2 results in an L-shaped recovery in GDP level. Hence, to have a V-shaped recovery in terms of level requires an S-shaped path (or overshooting) of the growth rate.
Historical GDP Recoveries
Now, let us look at two historical episodes to demonstrate the V-shaped versus L-shaped recoveries, and the policy implications for growth-rate targeting embodied in the previous hypothetical example.
The figure below plots real GDP, real consumption and real investment along with each series’ projected level trend (in dashed lines), assuming the level of each series just before the Great Recession would have grown after 2007 at the long-run average growth rate from 1947-2007. These projections give us an idea of what real GDP, consumption and investment would have looked like if the Great Recession had not occurred, or if policies designed to combat the Great Recession had been more effective.
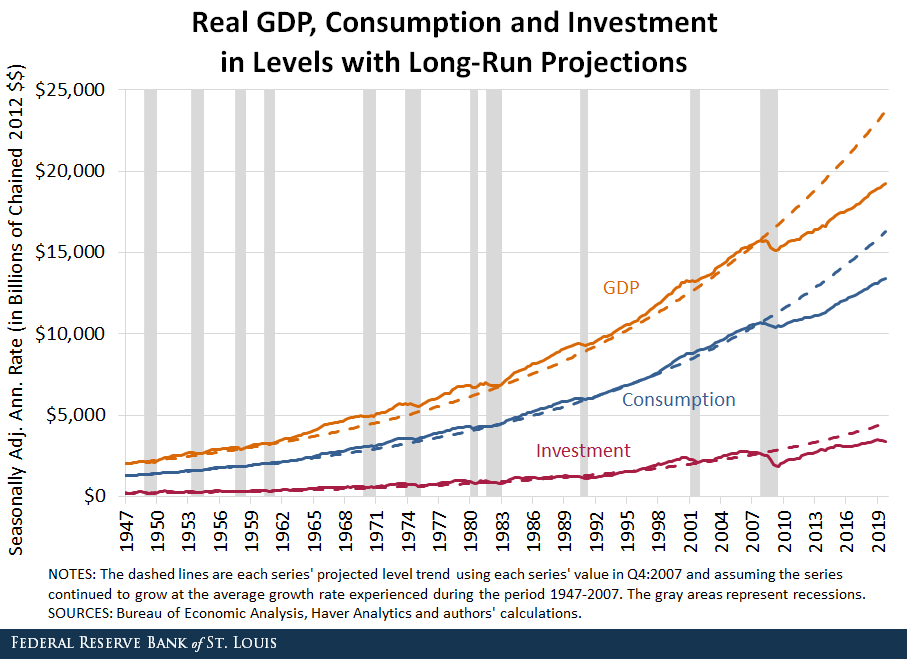
The figure shows that despite aggressive quantitative easing (QE) programs designed by the Fed and the government’s stimulus package during the Great Recession, the U.S. economy only managed to achieve an L-shaped recovery. Consequently, a permanent gap remained between projected real GDP and actual real GDP.
In other words, despite unprecedented monetary and fiscal policy during the Great Recession, the U.S. failed to achieve a V-shaped recovery in GDP level. The L-shaped recovery after the Great Recession does not necessarily mean that fiscal and monetary policy was inconsequential; instead, it could mean that it was simply not enough, unlike the U.S. experience during the Great Depression demonstrates.
GDP Recovery around the Great Depression
The figure below plots annual real GDP from 1901-50 and contains a similar projection analysis to understand the impact of the Great Depression on the long-run GDP level.The Great Depression was from August 1929 to March 1933. The dashed line is projected real GDP assuming the level of real GDP just before the Great Depression grew at the long-run average growth rate from 1902-29.
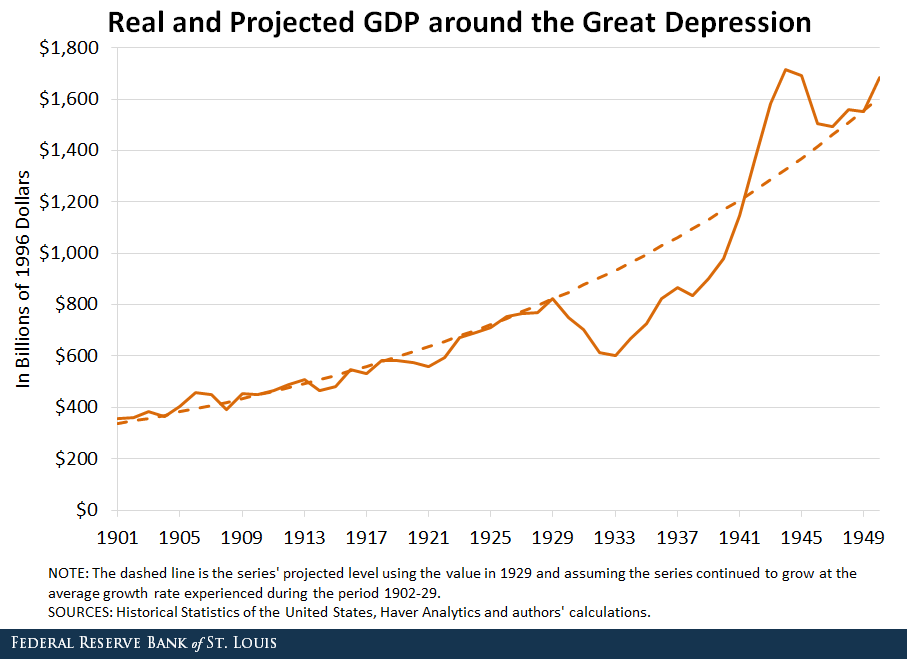
However, the growth rate accelerated from 1939 to 1944, and real GDP grew nearly four times as fast as its long-run trend from 1902-29. As a result, the level of real GDP had fully recovered by the 1940s, and it actually exceeded trend for a bit.
Reasons for a GDP Rebound from the Depression
Why was the U.S. eventually able to achieve a V-shaped recovery and even overshoot its long-run trend for a few years? The answer may lie in President Franklin Roosevelt’s aggressive fiscal stimulus package during the 1930s and ultimately a huge surge in government spending once World War II started.
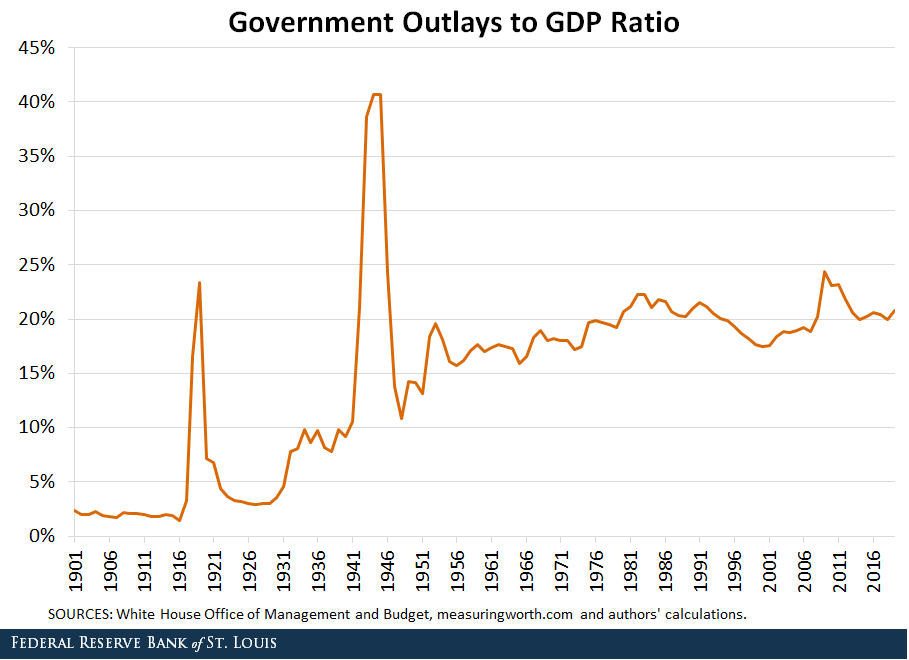
The figure above shows that government outlays as a share of GDP started to increase around 1931, then surged after 1941 and were eventually over 40% of GDP. Roosevelt’s fiscal stimulus package was likely responsible for the V-shaped recovery by 1941, and the huge increase in government spending to finance World War II was likely responsible for the S-shaped overshooting experience that occurred during the 1940s.World War II was from Sept. 1, 1939, to Sept. 2, 1945. So it seems that aggressive fiscal policies featuring excessive government spending were more powerful than primarily relying on the monetary QE stimulus adopted during the Great Recession.
Lessons for Stimulating the Economy
Using these historical examples as motivation, I (Yi) developed a model to better understand effective policy to stimulate the economy after the COVID-19 shock. I found that a combination of aggressive fiscal and monetary policies is necessary for the U.S. to achieve a V-shaped recovery in the level of real GDP. Aggressive policy means that the U.S. will need to consider negative interest rates and aggressive government spending, such as spending on infrastructure.
Importantly, these policies also need to continue even when the crisis is about to end to provide a further boost, leading to a more robust recovery. Furthermore, it’s the combination and coordination of both monetary and fiscal policies that provides enough stimulus for a V-shaped recovery. In other words, aggressive monetary policy—such as negative interest rates—may be ineffective on its own without aggressive fiscal stimulus. If the U.S. fails to have an S-shaped recovery in growth (which leads to a V-shaped recovery in the level of GDP), then the economic consequences of the coronavirus pandemic will be permanent.
Notes and References
1 The Great Depression was from August 1929 to March 1933.
2 World War II was from Sept. 1, 1939, to Sept. 2, 1945.
Additional Resources


Citation
Yi Wen and Brian Reinbold, ldquoHow to Achieve a V-Shaped Recovery amid the COVID-19 Pandemic ,rdquo St. Louis Fed On the Economy, May 29, 2020.
This blog offers commentary, analysis and data from our economists and experts. Views expressed are not necessarily those of the St. Louis Fed or Federal Reserve System.
Email Us
All other blog-related questions