


The Evolution of Total Trade in the U.S.
In a recent Economic Synopses essay and Regional Economist article, we examined the link between industrialization and historical U.S. trade flows. In this post, we revisit this topic by focusing on historical imports, exports and total goods trade as percentages of gross domestic product (GDP) to provide a different perspective. Again, we find that trade has played an integral role in U.S. development.
Total Trade: 1800-70
Total trade is the sum of imports and exports. It can be interpreted as a measure of openness to trade and the importance of trade to the economy, with higher total trade implying greater trade openness and that the economy is more reliant on trade.
From 1800-70, U.S. total trade to GDP averaged 13.8%, and we can see from the figure below that this was actually fairly high by historical standards.
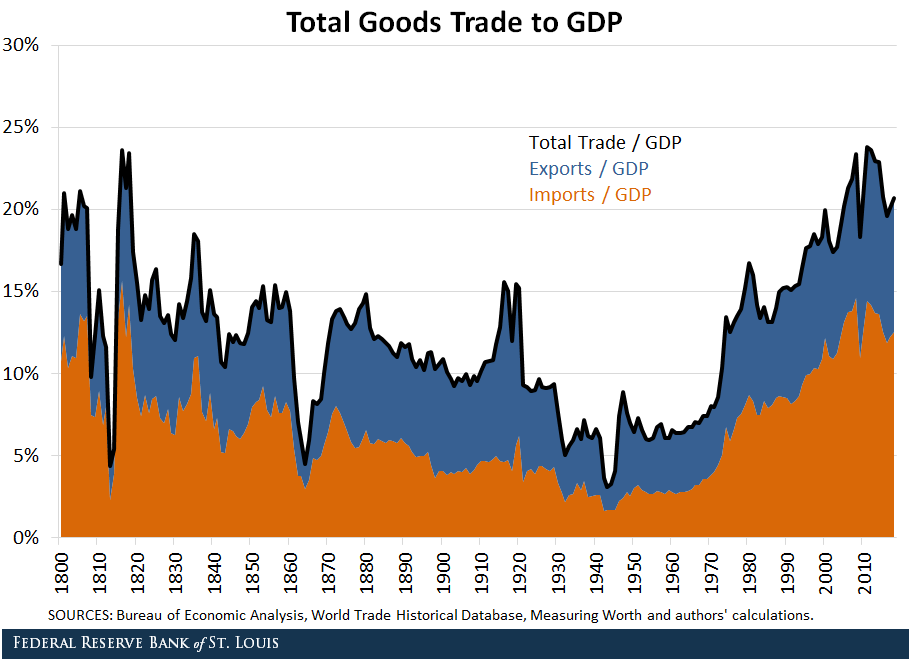
With the exception of precipitous drops during times of war (the War of 1812 and the Civil War) when total trade to GDP fell below 5%, the U.S. was heavily reliant on trade during this time period. The U.S. was a young economy and needed to import manufactured goods that it could not produce for itself or simply could not produce enough of to satisfy its own demand.
This demonstrates the importance of trade to the U.S.’s development, since the U.S. imported a large amount of manufactured goods that could also be used to facilitate its own industrialization. Despite running persistent trade deficits from 1800-70, these deficits do not seem to have inhibited the U.S.’s development and most likely facilitated it.
Total Trade: 1870-1929
Now from 1870-1929, we see a drop in average total trade to GDP to 11.4%. This result is primarily driven by a decline in imports as exports remained fairly steady during this period. The decline in imports was mainly due to a decline in imports of manufactured goods, especially finished manufactures.
The beginning of this period saw rising protectionist sentiment in the U.S., and average tariff rates spiked, decreasing demand for imports. Bairoch, Paul. “Economics & World History: Myths and Paradoxes.” The University of Chicago Press, 1995, pp. 40. However, U.S. manufacturing also became more developed and exceeded European manufacturing prowess by 1900, so the U.S. was less reliant on other nations for manufactured goods. Kitson, Michael; and Michie, Jonathan. “The Deindustrial Revolution: The Rise and Fall of U.K. Manufacturing, 1870-2010.” Working Paper No. 459, Centre for Business Research, University of Cambridge, June 2014. In some sense, the U.S. was becoming more self-reliant, as it could more easily satisfy domestic demand for manufactured goods.
Total Trade: 1929-70
However, we see a significant decline in total trade after 1929. An average total trade to GDP of just 6.4% from 1929-70 represents a historical all-time low. The beginning of this period was the Great Depression, resulting in depressed global demand for goods, which was further exacerbated by significant increases in tariff rates.
Although tariff rates were reduced after World War II, Bretton Woods imposed capital controls, so trade continued to flounder during this period. Trade would not reach its previous high until after the Bretton Woods system ended.
Total Trade: 1970-2018
Once Bretton Woods ended in 1971, total trade immediately spiked and doubled within a decade. The capital controls of Bretton Woods were lifted, liberalizing trade and ushering in a new era of globalization, and we see that the importance of trade has never been higher. Total trade to GDP averaged 16.8% from 1970-2018 and has trended up since 1970.
Historically, we see that trade has been an integral part of U.S. economic history.
Notes and References
1 Bairoch, Paul. “Economics & World History: Myths and Paradoxes.” The University of Chicago Press, 1995, pp. 40.
2 Kitson, Michael; and Michie, Jonathan. “The Deindustrial Revolution: The Rise and Fall of U.K. Manufacturing, 1870-2010.” Working Paper No. 459, Centre for Business Research, University of Cambridge, June 2014.
Additional Resources
- Economic Synopses: Historical U.S. Trade Deficits
- Regional Economist: How Industrialization Shaped America's Trade Balance


Citation
Yi Wen and Brian Reinbold, ldquoThe Evolution of Total Trade in the U.S.,rdquo St. Louis Fed On the Economy, March 2, 2020.
This blog offers commentary, analysis and data from our economists and experts. Views expressed are not necessarily those of the St. Louis Fed or Federal Reserve System.
Email Us
All other blog-related questions