


How Industrialization Shaped America's Trade Balance
KEY TAKEAWAYS
- The state of the U.S. trade balance appears closely linked to stages of the country’s industrialization.
- America’s changing economic structure affected its comparative advantage relative to those of other countries, which is a key determinant of trade patterns.
- The persistence of trade deficits may be related to the willingness of foreigners to hold U.S. financial assets.

Many Americans worry about the current size of the U.S. trade deficit. Yet relatively large trade deficits have been persistent during much of the country’s existence.
In an Economic Synopses published by the Federal Reserve Bank of St. Louis in May 2019, we broadly examined the link between industrialization and historical U.S. trade flows. In this article, we take a closer look at how industrialization may have affected the composition of U.S. trade and why certain trade patterns persisted in U.S. history.
Figure 1 shows the U.S. goods trade balance as a percentage of gross domestic product (GDP) from 1800 to 2018.The periods of all graphs are dictated by data availability. From 1800 to 1870, the U.S. ran a trade deficit for all but three years, and the trade balance averaged about –2.2% of GDP. Then from 1870 to 1970, the U.S. ran persistent trade surpluses that averaged about 1.1% of GDP. Around 1970, the country began to run trade deficits again, which have continued to this day. These shifts in the long-term U.S. trade balance appear to correspond well with U.S. industrialization in a global setting.
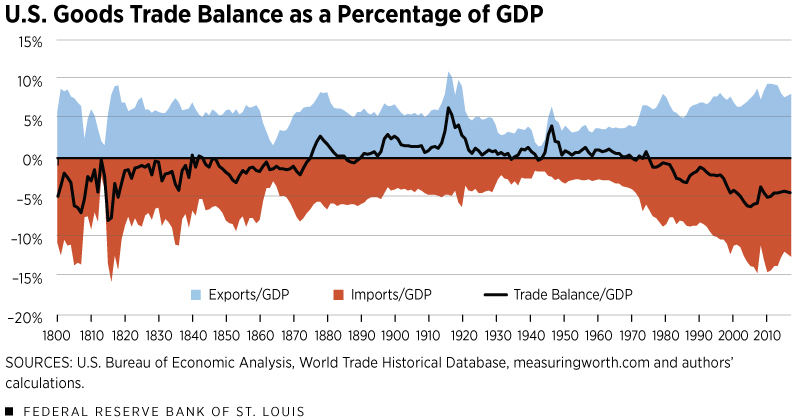
Historically, industrialization has three phases: (1) the first industrial revolution features labor-intensive mass production of light consumer goods, such as processed food and textiles; (2) the second industrial revolution features capital-intensive mass production of heavy industrial goods, such as steel, machinery, equipment and automobiles; and (3) the welfare revolution features mass consumption in a service-oriented welfare state.
We hypothesize that different phases of industrialization lead to structural changes that cause a nation’s comparative advantage to change relative to those of other nations. Since countries trade based on their comparative advantage, we would expect to see long-term changes to a country’s trade as it enters a new stage of development. Therefore, the long-term trends in Figure 1 can best be understood in the context of U.S. development.
Phase 1 (1800-1870)
As Europe, led by Great Britain, began to industrialize in the late 18th century, the U.S. remained primarily agrarian. U.S. industrialization began in the early 19th century, focusing on labor-intensive manufacturing, such as textiles. As a latecomer to industrialization and thus playing catch-up with Europe, the U.S. still had to import many manufactured goods, including machinery and other capital goods, and the country relied on the exports of crude materials, such as cotton. Europe produced manufactured goods more cheaply, and the U.S. could not yet match Europe’s prolific innovations. As a result, the U.S. ran trade deficits in several classes of manufactured goods.
Figure 2 shows the breakdown of U.S. trade by two aggregate classes of goods: raw materials and manufactured goods. The category of raw materials is the sum of crude materials (e.g., coal, petroleum and cotton) and crude foodstuffs (e.g., grains, produce, coffee and tea). The category of manufactured goods is the sum of manufactured foodstuffs (e.g., meat, sugar and processed fruits), semimanufactures (e.g., lumber, refined copper, and iron and steel plates) and finished manufactures (e.g., textile manufactures, machinery, equipment, automobiles and their parts, metal and steel, chemicals, and radios).
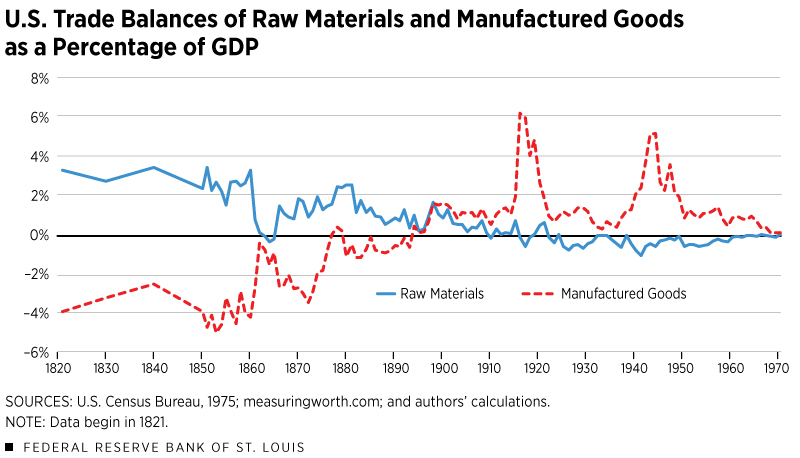
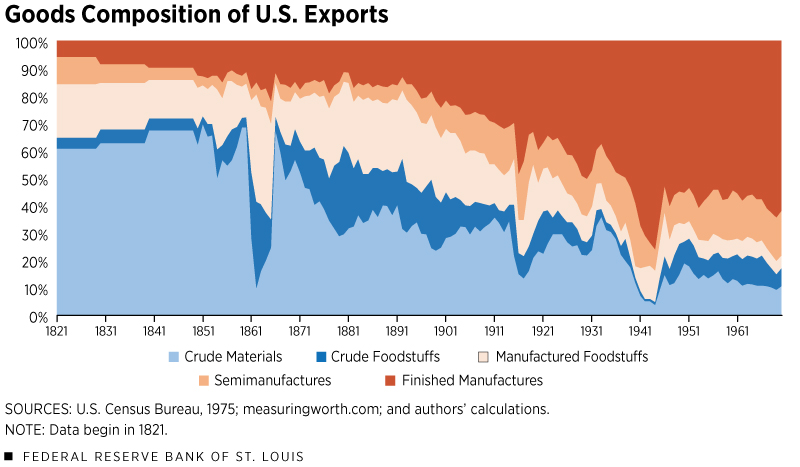
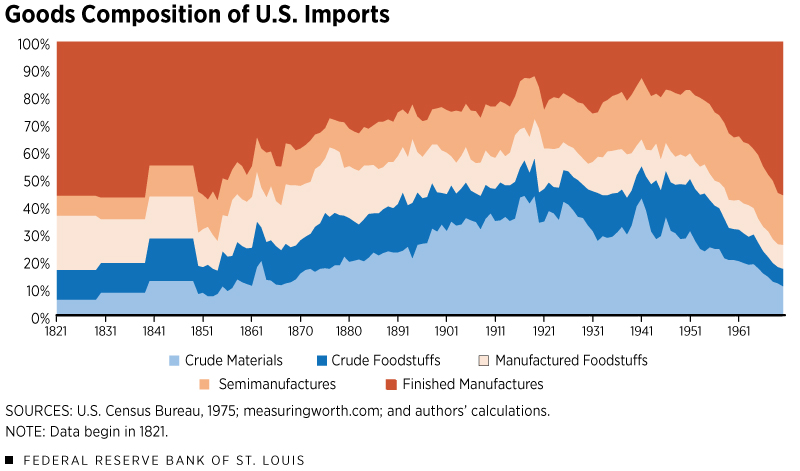
We see that the U.S. ran large deficits in manufactured goods throughout most of the 19th century, although the country showed a declining trend after the Civil War. Furthermore, the breakdown of trade in manufactured goods gives us insight into the progress of U.S. industrialization. (See Figures 3 and 4.)
(See sidebar at the end of the article.)
From 1821 to 1870, the U.S. posted slight deficits in manufactured foodstuffs and semi-manufactures and substantial deficits in finished manufactures. Manufactured foodstuffs (i.e., processed food) typically is the first sector to industrialize as it can be accomplished with little capital and lots of labor—perfect for early industrialization. Subsequently, semi-manufactures generally require more capital and sophisticated manufacturing processes to transform raw materials into products useful for other industrial processes. Finally, finished manufactures require significant amounts of capital and maturation of other manufacturing processes to be viable; therefore, they represent a high level of industrial sophistication.
The U.S. at this time lagged behind Europe in manufacturing and thus was more reliant on imports of finished manufactures. So the U.S. stage in development relative to those of other industrial nations led the country to run deficits in manufactured goods. The composition and size of the manufactured goods trade deficits exemplify the United States’ relative industrial development.
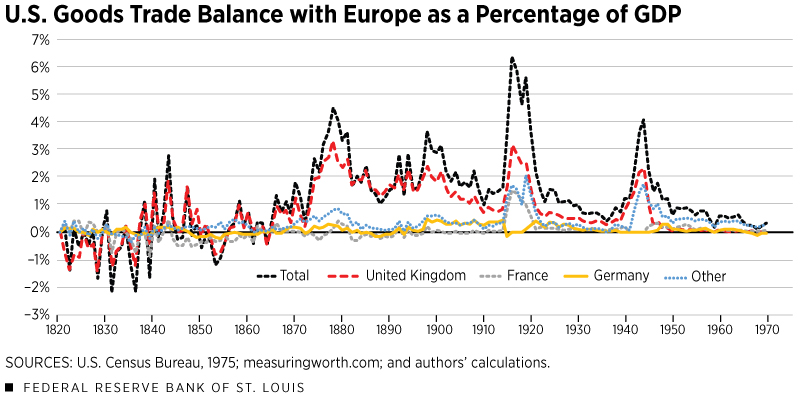
Since European countries were the only other industrialized economies at this time, the U.S. had to import manufactured goods from that continent. This was particularly true for finished manufactures because European countries were the only nations further along in their industrial development to possess the manufacturing sophistication necessary to fabricate these goods. Figure 5 shows the U.S. goods trade balance with Europe as a percentage of GDP.
Trade with Europe was primarily driven by trade with Great Britain: The U.K. represented around 60% of total U.S. trade (the sum of exports and imports) with Europe and around 40% of overall trade throughout most of the 19th century. The close historical ties between the U.S. and the U.K. made them natural trading partners.
Furthermore, trade with the U.K. would be essential for America’s own industrialization. Since the U.K. was the first country to industrialize, that country could produce more capital-intensive goods at lower cost than the U.S., so the U.S. would have to rely on imports to satisfy demand for manufactured goods.
We see that the U.S., on average, ran deficits with Europe from 1821 to 1840. So the U.S. likely imported a significant amount of capital goods and manufactured goods from the U.K. and the rest of Europe during this period to spur its own industrialization. Although the U.S. initially ran deficits with Europe, the trade balance fluctuated from deficit to surplus from 1840 to 1870. The U.S. imported manufactured goods from Europe, while Europe relied on raw materials from the resource-rich U.S. to sustain its own industrialization.
Phase 2 (1870-1970)
U.S. consumers benefited from imported manufactured goods, and furthermore, the country could import capital goods to facilitate its own industrialization. By 1870, improved manufacturing methods and the proliferation of railroads propelled the U.S. into the second phase of industrialization, which featured capital-intensive mass production of manufactured goods and machinery. This shift corresponds with a turning point in the U.S. trade balance—from persistent trade deficits to persistent trade surpluses. (See Figure 1.)
Increased sophistication and maturation of U.S. manufacturing drove this change as the country relied less on imports of manufactured goods, and exports of manufactured goods increased. In 1869, the U.S. imported three times as many manufactured goods as it exported, but by the turn of the century, the United States—now a manufacturing powerhouse—ran a full-fledged surplus in manufactured goods. (See Figure 2.) Furthermore, when we look at the composition of manufactured goods, we see how U.S. industrialization affected the country’s trade balance during this period.
The U.S. began to run persistent trade surpluses in manufactured foodstuffs by the mid-1870s. The U.S. at this point had well-developed labor-intensive manufacturing and thus was less reliant on imports and could export more of these goods. Furthermore, the U.S. trade deficit in finished manufactures shrank considerably in the 1870s, which was exceptionally important in shrinking the country’s overall trade deficit. The shrinking deficit in finished manufactures exemplifies America’s increasing sophistication in manufacturing capital-intensive goods. In 1898, the U.S. began to run consistent surpluses in finished manufactures, signifying the nation as a global industrial powerhouse.
Returning to Figure 5, we also see a noticeable upward shift in the overall U.S. trade balance with Europe starting in the early 1870s. The average U.S. trade balance with Europe from 1821 to 1870 was essentially zero but rose to a surplus of about 1.7% of GDP from 1870 to 1970.
Although the U.S. began to run trade surpluses with Europe prior to 1870, the key takeaway is the shift in level. The year 1870 marks a turning point in the country’s relative comparative advantage with Europe. The U.S. entered the capital-intensive phase of industrializing and was then quickly catching up to Europe’s manufacturing prowess. The U.K. capital per worker was 10% higher than U.S. capital per worker in the 1870s, but by 1900, the U.S. ratio was 90% higher (i.e., more capital intensive) than that of the U.K. In addition, the U.K. accounted for 43% of world manufactured exports in the mid-1880s, whereas the U.S. accounted for only 6%. By 1913, however, the U.K. share of manufactured exports had fallen to 32%, while the U.S. share had more than doubled.See Kitson and Michie.
Instead of just following Europe’s industrialization, the U.S. became a leading innovator, and its manufacturing prowess rapidly caught up to the rest of Europe. Ultimately, the U.S. relied less on imports of manufactured goods from Europe, and its manufacturing exports flourished, which resulted in trade surpluses that persisted until 1970.
Phase 3 (1970-Present)
Since the 1970s, the U.S. has shifted to the welfare stage, featuring credit-based mass consumption with financial innovations. This shift implies that the country became able to consume more tangible goods than it produced by providing services (such as consulting and financial services) to the world.
During the early 1970s, the U.S. goods trade balance experienced another inflection point—from trade surpluses to trade deficits. (See Figure 1.) Again, this shift also corresponded with a structural change in the economy as the U.S. entered this third stage of development.
Figure 6 shows the U.S. trade balance in services from 1929 to 2018.
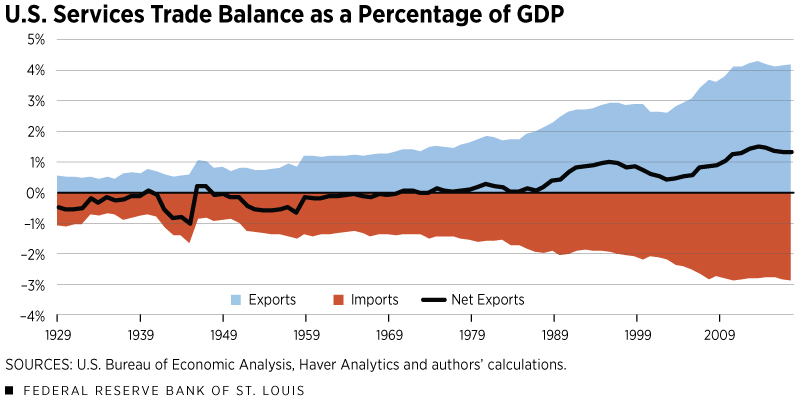
Starting in 1970, the U.S. services trade balance qualitatively mirrors the country’s goods trade balance: The trade balance in services goes from persistent deficits to continuously increasing surpluses, while the trade balance in goods goes in the opposite direction. Also, the volume of U.S. trade in services has nearly tripled since 1970, demonstrating the country’s global comparative advantage in providing services. In addition, we find that the U.S. began to run trade deficits in goods with Europe after 1980 and that the U.S. has been running trade surpluses in services with Europe since 1999 (the first year that data are available).
Other Factors Affecting the Trade Balance
The U.S. ran persistent trade deficits for long periods of its history, just as it does today. Yet, trade deficits did not inhibit U.S. development and may have even facilitated industrialization as the country imported capital goods to improve its own manufacturing during this first phase of industrialization.
We use our theory of global shifting of relative comparative advantage to explain these long-run shifts in the level of the U.S. trade balance. We saw how industrialization affected the composition of U.S. exports and imports, and how relative development could affect trade balances with other nations (namely Europe). One caveat to our hypothesis is that it is not clear how industrialization necessarily results in deficits or surpluses.
Clearly, industrialization affects the composition of goods that a nation can produce, which then affects what goods that nation can trade (e.g., a country cannot export cars if it cannot produce them). However, this does not necessarily imply trade deficits or trade surpluses. According to the national accounting identity, net exports are the difference between gross savings and gross investment.This idea follows from the national account identity that gross domestic product (GDP) is the sum of consumption, investment, government spending and net exports (Y = C + I + G + NX). Gross savings are defined as GDP minus consumption and government spending (S = Y – C – G). Then by rearranging the national accounting identity with the definition of gross savings, we obtain the relationship that net exports are equal to national savings minus investment (NX = S – I). Therefore, a nation runs a trade deficit when savings are less than investment (S < I) and runs a trade surplus when savings are greater than investment (S > I). Therefore, industrialization has to affect gross savings or gross investment to affect the trade balance, but this mechanism is not obvious.
Furthermore, it’s clear how comparative advantage drives the pattern of observed trade, but comparative advantage does not necessarily explain why these deficits or surpluses persisted in each phase. For example, when the U.S. runs a persistent trade deficit (as we see in Phase 3), foreigners are willing to exchange goods for U.S. financial assets, such as U.S. dollars and U.S. securities, and are willing to hold these financial assets for prolonged periods of time. Why are foreigners satisfied with holding on to U.S. financial assets instead of exchanging them for U.S. goods?
Phase 3 corresponds with a unique development in the international financial system: the end of the Bretton Woods system and the rise of the U.S. dollar as the world reserve currency. Essentially, the U.S. dollar became as good as gold, and foreigners have been willing to hold U.S. dollar securities as a safe store of value, leading to persistent trade deficits in Phase 3.See Reinbold and Wen, 2018, for more details. Extending this logic to the previous phases, gold was useful for settling international transactions, and the precious metal also served as a safe store of value.
This logic implies that the U.S. must have experienced persistent net outflows of gold during Phase 1 and persistent net inflows of gold during Phase 2. Indeed, the historical data reveal net outflows of gold from the U.S. during the early 19th century and net inflows of gold to the U.S. during the early 20th century. So during Phase 2, the U.S. likely accumulated and maintained large holdings of gold as a safe store of value, resulting in persistent trade surpluses. Phase 1 mostly saw gold flowing out of the U.S., and foreigners were willing to hold on to this gold. Another possible factor that sustained the U.S. trade deficits during Phase 1 is that foreigners were willing to hold U.S. land as a safe store of value.
To summarize, each phase may have corresponded with a financial asset serving as a safe store of value (gold and land in Phase 1, gold in Phase 2, and the U.S. dollar in Phase 3), and others were willing to hold these assets in each phase, which ultimately led these trade patterns to persist for many decades.
Conclusion
Trade is complicated, and further research is needed to better understand these long-term historical trends. Studying both changes in the U.S. industrial composition and how this may affect savings, investment and the holdings of financial assets can help build a complete picture of what factors drove the historical U.S. trade balance.
However, it seems reasonable to expect that transitioning into different stages of industrialization will cause structural changes in an economy, including changes in a country’s comparative advantage relative to those of other nations. And comparative advantage is the driving force behind international trade. So not all developing countries will follow the same pattern (i.e., from trade deficit to surplus, back to deficit), but we would expect to see long-run shifts in overall trade balances as a nation develops.
Endnotes
- The periods of all graphs are dictated by data availability.
- See Kitson and Michie.
- This idea follows from the national account identity that gross domestic product (GDP) is the sum of consumption, investment, government spending and net exports (Y = C + I + G + NX). Gross savings are defined as GDP minus consumption and government spending (S = Y – C – G). Then by rearranging the national accounting identity with the definition of gross savings, we obtain the relationship that net exports are equal to national savings minus investment (NX = S – I). Therefore, a nation runs a trade deficit when savings are less than investment (S < I) and runs a trade surplus when savings are greater than investment (S > I).
- See Reinbold and Wen, 2018, for more details.
References


Views expressed in Regional Economist are not necessarily those of the St. Louis Fed or Federal Reserve System.
For the latest insights from our economists and other St. Louis Fed experts, visit On the Economy and subscribe.
Email Us