Shifts in U.S. Trade Balance and Industrialization

The following post is the second in a two-part series that examines the link between the stages of U.S. industrialization and the country’s balance of trade. The first post looked at the period from 1800 to 1870.
In a recent Regional Economist article, Assistant Vice President and Economist Yi Wen and Research Associate Brian Reinbold explored how industrialization may have affected the composition of U.S. trade and why certain trade patterns persisted in U.S. history.
Industrialization has historically had three phases, the authors wrote. They explained that phase 1 of industrialization involves labor-intensive mass production of light consumer goods, such as processed food and textiles. This phase took place in the U.S. from 1800 to 1870, during which the U.S. ran deficits in manufactured goods. During this time, the country could import capital goods to facilitate its industrialization, leading the U.S. into phase 2.
Phase 2 of industrialization features capital-intensive mass production of heavy industrial goods. Phase 3, which the authors referred to as the welfare revolution, features mass consumption in a service-oriented welfare state.
A Turning Point in the Trade Balance
The second phase of U.S. industrialization lasted from 1870 to 1970 and featured capital-intensive mass production of manufactured goods and machinery, the authors wrote. This shift—driven by increased sophistication and maturation of U.S. manufacturing—marked a turning point in the U.S. trade balance.
The authors broke down the category of manufactured goods into three types: manufactured foodstuffs (such as meat, sugar and processed fruits), semimanufactures (such as lumber, refined copper, and iron and steel plates) and finished manufactures (such as textile manufactures, machinery and equipment). By the mid-1870s, the U.S. began to run persistent trade surpluses in manufactured foodstuffs, Wen and Reinbold noted. In 1898, the U.S. began to run consistent surpluses in finished manufactures. By the turn of the century, it ran a full-fledged surplus in manufactured goods.
The year 1970 marks a turning point in the country’s relative comparative advantage with Europe. During this capital-intensive phase of industrializing, the U.S. quickly caught up with Europe’s manufacturing prowess and became a leading innovator, the authors explained.
From Trade Surpluses to Trade Deficits
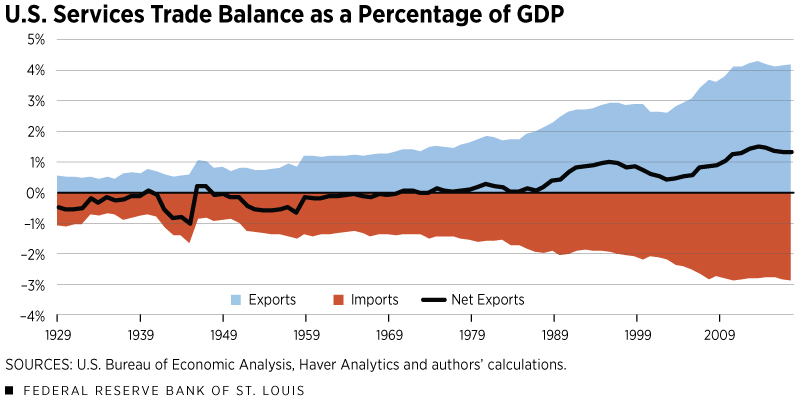
In the 1970s, the U.S. entered its third stage of development, where it remains today. During this welfare stage, Wen and Reinbold wrote, the country became able to consume more tangible goods than it produced by providing services to the world.
The trade balance in services shifted from persistent deficits to continuously increasing surpluses, while the goods trade balance shifted back to persistent deficits. According to the authors, the volume of U.S. trade in services has nearly tripled since 1970. This demonstrates the country’s global comparative advantage in providing services.

Conclusion
While comparative advantage drives patterns of trade, the authors pointed out, it does not necessarily explain why deficits or surpluses persisted in each phase of industrialization. To account for this, they wrote that each phase may have corresponded with a financial asset serving as a safe store of value, which others were willing to hold. For example foreigners were willing to hold gold and U.S. land in phase 1, Americans were willing to hold gold in phase 2, and foreigners are willing to hold U.S. dollars in phase 3.
The authors recognized that trade is complicated and further research is needed to better understand these long-term historical trends. However, they concluded that we would expect to see long-run shifts in overall trade balances as a nation develops.
Additional Resources
- Regional Economist: How Industrialization Shaped America’s Trade Balance
- On the Economy: Comparing Value-Added Trade and Gross Trade
- On the Economy: The Evolution of Total Trade in the U.S.
Citation
ldquoShifts in U.S. Trade Balance and Industrialization,rdquo St. Louis Fed On the Economy, July 21, 2020.
This blog offers commentary, analysis and data from our economists and experts. Views expressed are not necessarily those of the St. Louis Fed or Federal Reserve System.
Email Us
All other blog-related questions

