


Rising Student Debt and the Great Recession
Outstanding student debt in the U.S. has more than tripled since 2006, surpassing $1.6 trillion. Student debt started at 4% of gross domestic product in 2006, rose drastically throughout the Great Recession and stabilized at nearly 8% of GDP in 2016. This dramatic growth has made student debt a much-discussed topic among policymakers and the public, but little is usually said about its specific components.
In this blog post, we’ll take a closer look at loans taken out since 2006 and at the students behind them. The fact that overall student debt more than tripled during this period means that new borrowing substantially exceeded repayment of old debt. Our focus here is on new borrowing.
New Loans: Undergraduate and Graduate
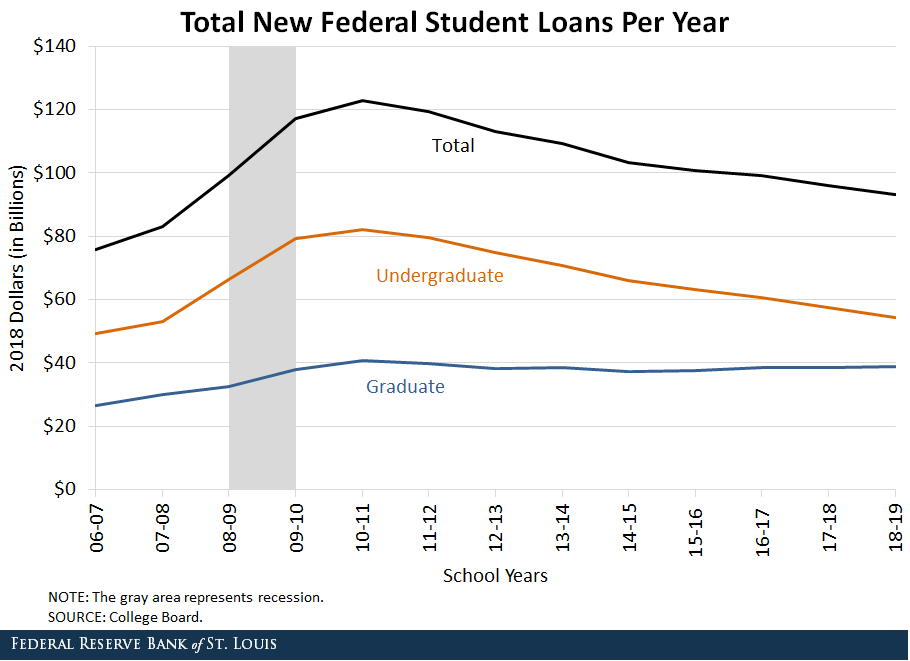
Since 2006, graduate school students have taken on an increasing fraction of total new loans, accounting for roughly one-third of loans taken out in 2006 and around 40% of loans taken out in 2018. The figure below reveals that this shift in the composition of new loans took place after the Great Recession: Annual undergraduate borrowing gradually declined, while annual graduate borrowing remained fairly flat. Today, about 50% of total student debt is owed by households with a graduate degree.Pyne, Jaymes and Grodsky, Eric. “Inequality and Opportunity in a Perfect Storm of Graduate Student Debt.” Sociology of Education, January 2020, Vol. 93, No. 1, 20-39.
New Loans: Two-Year and Four-Year Undergraduates
The figure also reveals dramatic growth in student borrowing—especially undergraduate borrowing—during the onset of and throughout the Great Recession. This was likely driven by the slowdown of economic growth and more scarce employment opportunities, which would sway some high school graduates who might normally have entered the workforce after high school to attend college instead.
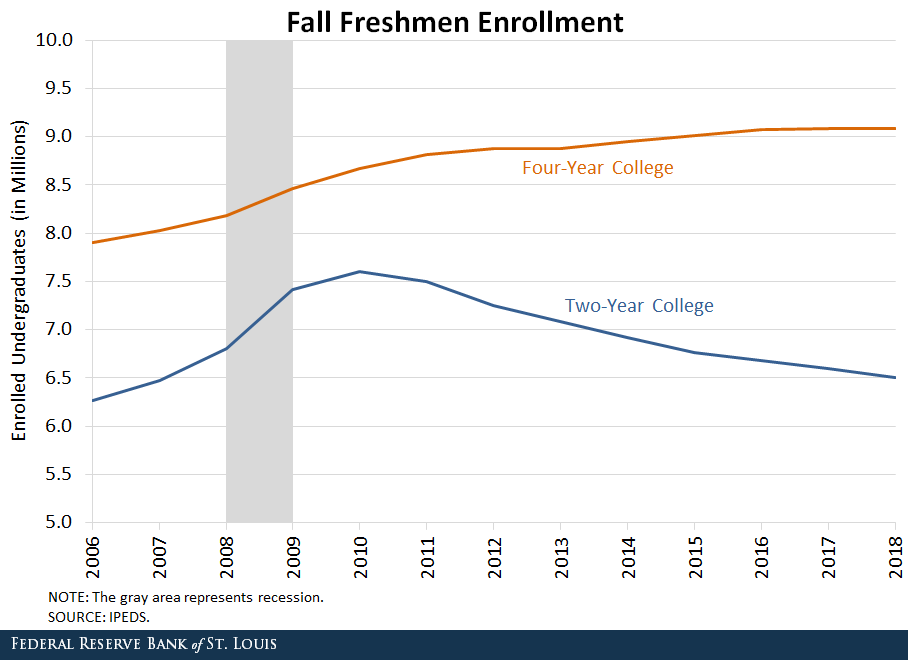
Consistent with our conjecture, the next figure reveals that undergraduate enrollment in open-admission two-year colleges – the primary destination for these marginal students – increased by 20% during this period before subsequently declining and returning to its original trend during the period of economic recovery.This pattern is driven almost entirely by the dynamics in enrollment rate, and not by the demographic change. In contrast, enrollment in four-year colleges followed a relatively stable upward trend, with only a very slight acceleration during the recessionary period.Note that these numbers should not be directly compared to the earlier graph, which includes all undergraduates (not just newly enrolled, full-time ones) and a wider variety of institutions.
The next figure shows average annual undergraduate borrowing among full-time students. It reveals that average student-level borrowing played the most important role in the evolution of total annual student debt.
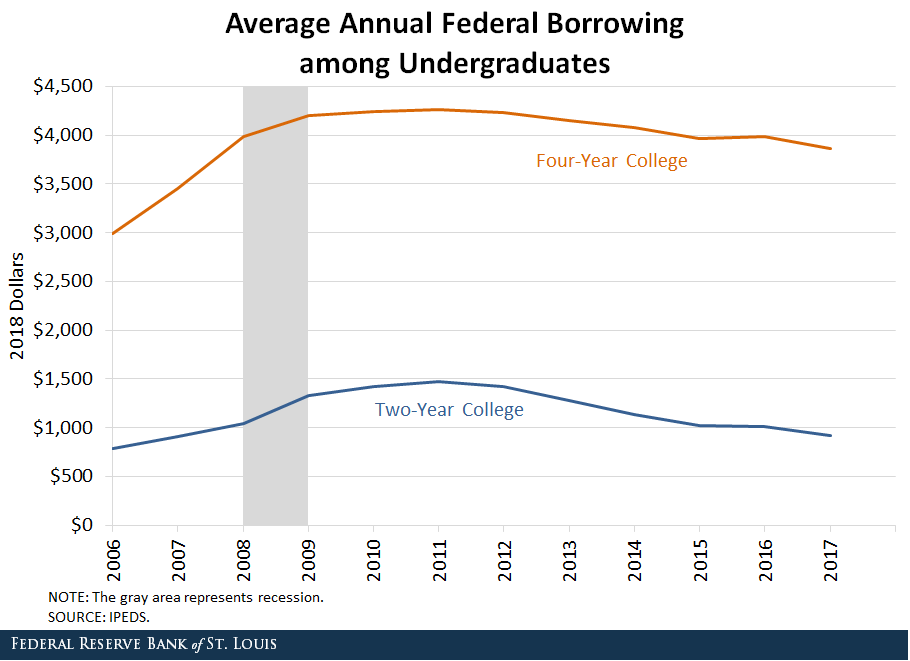
Average annual borrowing among students at two-year colleges increased by nearly 50% during the recession, double the contemporaneous rise in enrollment levels. Four-year college students also took on substantially more debt immediately before and during the recession, thereby also contributing to the overall debt growth.
The annual amount borrowed declined by a smaller amount as the economy recovered, indicating that the main reason for the increased borrowing was not the decline in parental transfers or part-time job opportunities during the recessionary period, but rather the steady increase in the average cost of college.The average tuition and fees paid by the students rose over 60% during this period.
Effect of Time Spent in College
Thus far, we discussed freshman enrollment rates and average annual borrowing per undergraduate student. The remaining important factor behind the total amount of annual debt taken on by undergraduates is the length of time students spend in college.
In fact, this period saw an important increase in graduation rates among undergraduates—from 46% to 53%—and there is evidence that the time needed to graduate increased as well. Integrated Postsecondary Education Data System, National Postsecondary Student Aid study and authors’ calculations. These trends increased the overall number of college students in any given year, further pushing up annual undergraduate borrowing.
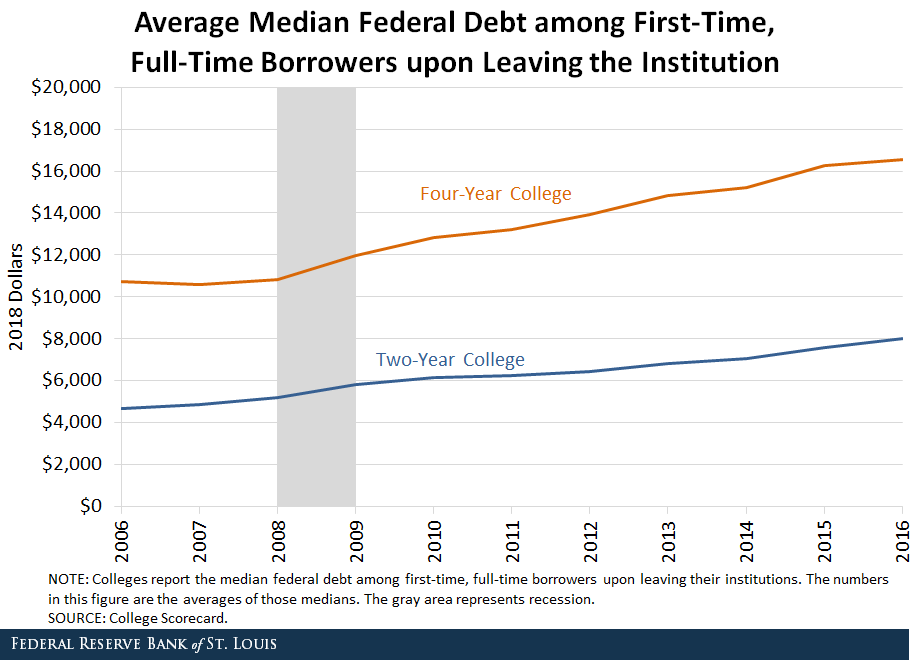
These trends also explain why median student debt upon leaving undergraduate institutions has continuously increased throughout this period, despite average annual loans declining since 2011: When students stay in college longer, they tend to accumulate more debt by the time they leave.
The figure below illustrates median student debt upon leaving the institution among first-time, full-time borrowers.
Conclusion
We saw that graduate students and four-year undergraduate students have taken on an increasing fraction of annual student loans, as tuition and fees have continued to climb and students have spent more years in college. These trends are likely to continue.
We also saw that two-year college students contributed substantially to the rapid growth of student debt during the Great Recession through the temporary spike in both enrollment and average borrowing.
It will be interesting to see if the greater schooling attainment seen during this period will result in greater repayment rates, which would help slow down the growth of the overall stock of student debt.
Notes and References
1 Pyne, Jaymes and Grodsky, Eric. “Inequality and Opportunity in a Perfect Storm of Graduate Student Debt.” Sociology of Education, January 2020, Vol. 93, No. 1, 20-39.
2 This pattern is driven almost entirely by the dynamics in enrollment rate, and not by the demographic change.
3 Note that these numbers should not be directly compared to the earlier graph, which includes all undergraduates (not just newly enrolled, full-time ones) and a wider variety of institutions.
4 The average tuition and fees paid by the students rose over 60% during this period.
5 Integrated Postsecondary Education Data System, National Postsecondary Student Aid study and authors’ calculations.
Additional Resources
- On the Economy: Are Student Loans Contributing to Racial Wealth Gaps?
- On the Economy: Marriage, Young Households and Student Loan Debt
- On the Economy: How Do Students Pay for College?

Citation
Oksana Leukhina, ldquoRising Student Debt and the Great Recession,rdquo St. Louis Fed On the Economy, Jan. 14, 2020.
This blog offers commentary, analysis and data from our economists and experts. Views expressed are not necessarily those of the St. Louis Fed or Federal Reserve System.
Email Us
All other blog-related questions