


U.S. Population Growth Slowing to a Crawl

The U.S. Census Bureau recently estimated that annual growth of the U.S. resident population in 2019 was only about 0.5%.“2019 U.S. Population Estimates Continue to Show the Nation’s Growth Is Slowing.” U.S. Census Bureau, Dec. 30, 2019. The U.S. population was 328,239,523 on July 1, 2019, an increase of 1,552,022 (or 0.48%) over July 1, 2018. The Census press release highlighted a natural increase in population—births minus deaths, excluding the effects of immigration—of less than 1 million, which occurred in 2019 “for the first time in decades.” Net international migration also reached a multiyear low of just under 600,000.
Less heralded but perhaps more consequential for the economy were two other notes:
- The historically low rate of overall population growth (natural increase plus net migration)
- The third straight year of significant deceleration
Slowing population growth directly leads to slower economic growth because the potential labor force grows more slowly in the future. This, in turn, may lower investment demand and interest rates, because there will be less need for new business equipment, housing and other capital goods to accommodate a slow-growing population and workforce.Summers, Lawrence H. “Secular Stagnation and Monetary Policy.” Federal Reserve Bank of St. Louis Review, Second Quarter 2016, Vol. 98, Issue 2, pp. 93-110.
The recent pronounced slowdown in population growth could portend slower long-term population growth than previously expected by investors. Therefore, it could be part of the explanation for historic low yields of long-term bonds, such as the 30-year Treasury bond.
A falling population growth rate in the midst of an apparently healthy economy hints at underlying noneconomic forces affecting the birth rate, death rate, immigration rate or all three in unusual ways. Whatever these forces might be, U.S. population growth in 2019 may have been the slowest in our nation’s history outside times of war, and the long-term economic consequences could be significant.
Population Growth Prior to 1900
We cannot be sure that 2019’s growth was the slowest in U.S. peacetime history. Single-year population estimates do not exist outside of decennial census years before 1901. But it is reasonable to assume that single-year population growth before 1900 was never as low as 0.5% because all annualized decadal average growth rates before 1900 were at least 1.9%, as seen in the figure below.For a detailed discussion of U.S. population growth before the 20th century, see Haines, Michael R. “The Population of the United States, 1790-1920.” Chapter 4 in The Cambridge Economic History of the United States, Volume 2: The Long Nineteenth Century, Cambridge University Press, 2000.
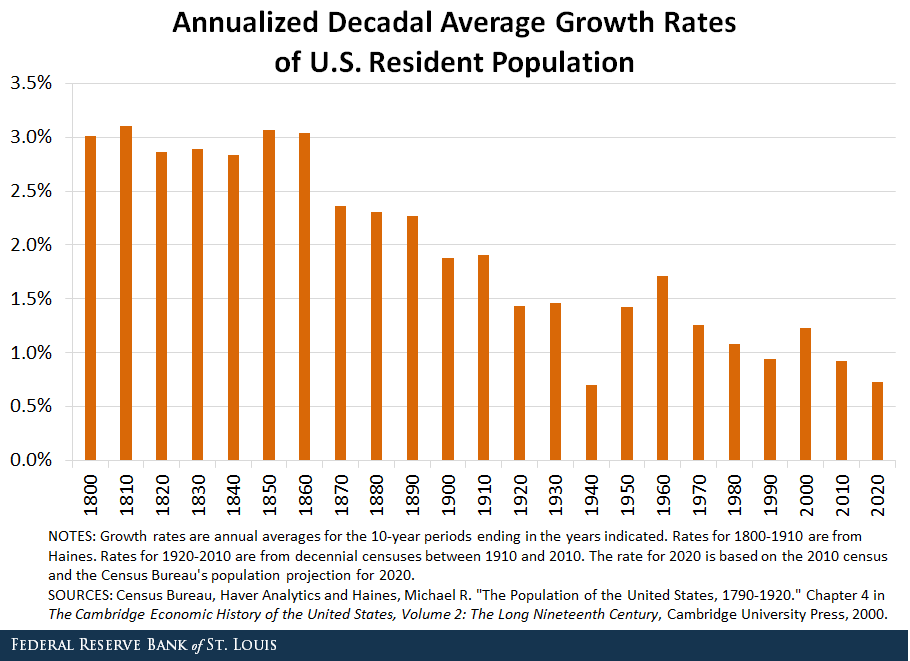
Exceptional events like wars and public-health crises can result in very low single-year population growth rates.Neither slavery nor its abolition distorted census tallies of the resident population. All enslaved and free people of all races and ethnicities were counted in every census.
For example, the figure shows that the annualized average population growth rate declined sharply in the decade containing the Civil War (noted in the 1870 bar), reflecting changes in both birth and death rates. But data from the 1850, 1860 and 1870 censuses show that a decline in immigration into the U.S. was a larger contributor to slower population growth than changes in birth and death rates.Using consecutive censuses to calculate sources of decadal population growth, Table 1 in Haines shows that the rate of net international migration declined by 0.41 percentage points between the 1850s and the 1860s, while natural increase declined by 0.27 percentage points. Thus, it seems likely—though by no means certain—that population growth was never as low as 0.5% in any single year prior to 1900.
Instances of Slow Growth in the 20th Century
The Census Bureau has provided single-year resident population estimates since 1901 and an annual population series adjusted for the presence of U.S. armed forces overseas since 1940. These data are shown in the figure below.
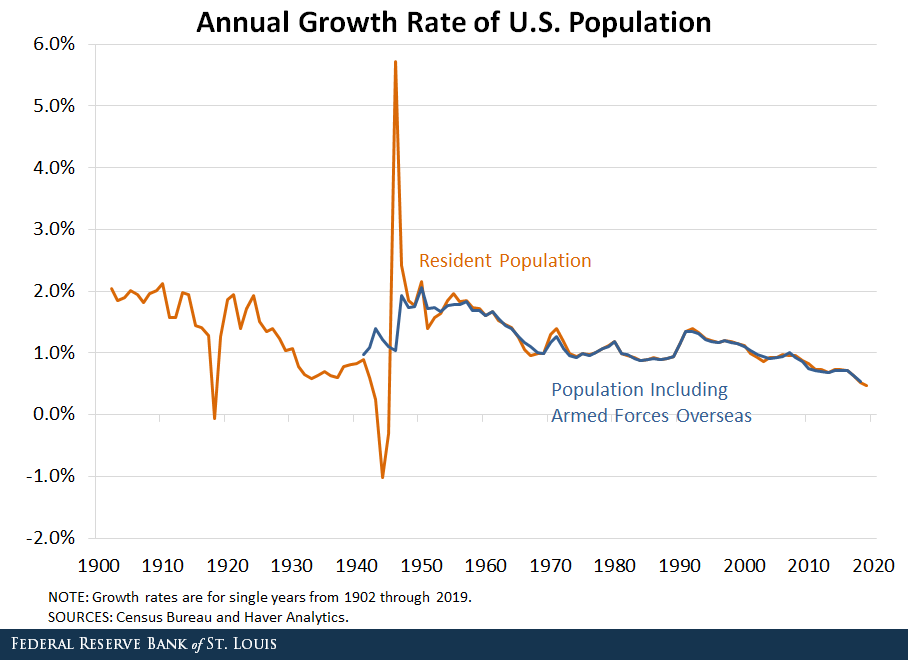
Three periods in the first half of the 20th century stand out:
- 1918
- The 1930s
- The 1940s
Close examination of these episodes confirms that population growth in 2019 was the slowest in peacetime since 1941 and very likely in U.S. peacetime history.
World War I
The U.S. resident population declined by 0.06% in 1918, while growth rates were almost 1.3% in both 1917 and 1919. Three important and interrelated events occurred in 1918 that combined to eliminate any growth of resident population:
- World War I: As many as 2 million troops were sent to Europe in 1917 and 1918.See the Spartacus Educational article “The United States Army and the First World War.”
- Flu pandemic: About 675,000 Americans died from flu in 1918 and 1919, spread in large part by troop movements within the U.S.See the Centers for Disease Control and Prevention’s blog post “The 1918 Flu Pandemic: Why It Matters 100 Years Later.”
- Immigration collapse: Immigration into the U.S. declined from about 1.2 million in 1914 to a low of only about 100,000 in 1918, although the bulk of the decline in annual immigration rates occurred 1915-17, after the war in Europe began but before the U.S. entered.See Figure 1 in Haines.
It’s difficult to quantify the contributions of each factor to the collapse in population growth in 1918. However, because they all are connected to WWI, we can safely say that a peacetime year like 2019 should not be compared directly to 1918 to gauge underlying population trends.
The Great Depression
The peacetime period that comes closest to 2019’s low population growth is the Great Depression in the 1930s. Population growth dropped below 1% in 1931 and remained there until World War II. Growth rates averaged 0.70% during 1931-40—reaching a low of 0.59% in 1933—but still higher than the 2019 growth rate of 0.48%. The figure above suggests that population growth would have returned to 1% or more beginning in 1941 had the war not occurred.
Data from the 1920, 1930 and 1940 censuses reveal that, while the death rate changed little in the 1930s compared to the 1920s, the birth rate fell by more than 20%.See Table 2 in Haines. Recovery of the birth rate after World War II constituted the beginning of the baby boom. The second major contributor to slow population growth was lower immigration. As was the case during WWI, immigration collapsed in the 1930s, albeit from a much lower starting point. After taking in about 250,000 people in 1930, net U.S. immigration virtually ceased from 1932 to 1940.See Figure 1 in Haines.
In sum, the Great Depression caused population growth to be very weak for nearly a decade. Nonetheless, even in the gloom of 1933, population growth was higher than it was in 2019. The similarity of population growth rates in 1933 and 2019 is striking because the unemployment rate in 1933 was estimated to be 25%, while it was less than 4% in 2019—the lowest in 50 years.
World War II
In unadjusted terms, resident population growth was weaker in three WWII years than it was in 2019:
- 0.24% in 1943
- -1.01% in 1944
- 0.30% in 1945
After adjusting for the movement of armed forces overseas, however, population growth in each year would have been over 1%. Thus, underlying population growth was much higher in the 1940s than it has been recently.
The very low recorded growth rates in 1943, 1944 and 1945 reflect military deployments during the war. As troops returned, the annual growth rates of resident population were 5.72% in 1946 and 2.42% in 1947. The baby boom was then underway, lifting population growth rates to levels not seen in the U.S. since before WWI.
Conclusion
The U.S. resident population grew by less than 0.5% in 2019, possibly the slowest peacetime rate ever. This marks the third consecutive year of noticeable deceleration. Such low and falling growth rates are unusual when no major war is underway in what appears to be a healthy economy. The slowdown seems to be due to adverse trends in birth rates, death rates and immigration, and it could reduce economic growth, investment and interest rates if it persists.
Notes and References
1 “2019 U.S. Population Estimates Continue to Show the Nation’s Growth Is Slowing.” U.S. Census Bureau, Dec. 30, 2019. The U.S. population was 328,239,523 on July 1, 2019, an increase of 1,552,022 (or 0.48%) over July 1, 2018.
2 Summers, Lawrence H. “Secular Stagnation and Monetary Policy.” Federal Reserve Bank of St. Louis Review, Second Quarter 2016, Vol. 98, Issue 2, pp. 93-110.
3 For a detailed discussion of U.S. population growth before the 20th century, see Haines, Michael R. “The Population of the United States, 1790-1920.” Chapter 4 in The Cambridge Economic History of the United States, Volume 2: The Long Nineteenth Century, Cambridge University Press, 2000.
4 Neither slavery nor its abolition distorted census tallies of the resident population. All enslaved and free people of all races and ethnicities were counted in every census.
5 Using consecutive censuses to calculate sources of decadal population growth, Table 1 in Haines shows that the rate of net international migration declined by 0.41 percentage points between the 1850s and the 1860s, while natural increase declined by 0.27 percentage points.
6 See the Spartacus Educational article “The United States Army and the First World War.”
7 See the Centers for Disease Control and Prevention’s blog post “The 1918 Flu Pandemic: Why It Matters 100 Years Later.”
8 See Figure 1 in Haines.
9 See Table 2 in Haines. Recovery of the birth rate after World War II constituted the beginning of the baby boom.
10 See Figure 1 in Haines.
Additional Resources
- On the Economy: Aging Populations May Mean Lower Economic Growth
- On the Economy: Link between Real Income and Future Population Growth

Citation
William R. Emmons, ldquoU.S. Population Growth Slowing to a Crawl,rdquo St. Louis Fed On the Economy, Feb. 10, 2020.
This blog offers commentary, analysis and data from our economists and experts. Views expressed are not necessarily those of the St. Louis Fed or Federal Reserve System.
Email Us
All other blog-related questions