Do Banks Have Pricing Power?

By David Wheelock, Group Vice President and Deputy Director of Research
Since reaching a peak in the mid-1980s, the number of commercial banks in the U.S. has fallen by more than two-thirds, from 14,483 banks in 1984 to 4,909 banks at the end of 2018. Meanwhile, the share of total bank deposits and assets held by the very largest banks has been rising.
Market Concentration vs. Market Competition
These trends have prompted concerns about the level of competition in the banking industry. Bank regulators and the Justice Department must approve all bank mergers and will ordinarily disallow mergers that would result in highly concentrated local banking markets.
However, concentration is not necessarily a good measure of market competition. If the barriers to enter a market are low, then firms might be unable to set prices higher than the competitive level even if the market is highly concentrated. If they tried, new firms might enter the market and force prices down.
The Lerner Index
The Lerner Index—named after economist Abba Lerner—is one measure of pricing power. Lerner identified the degree of a firm’s pricing power as the difference between the firm’s output price and its marginal cost at the profit-maximizing level of output.See Elzinga, Kenneth G.; and Mills, David E. “The Lerner Index of Monopoly Power: Origins and Uses (PDF).” American Economic Review: Papers and Proceedings, May 2011, Vol. 101, No. 3, pp. 558-64.
Standard microeconomic theory posits that price will equal marginal cost under perfect competition. Thus, firms operating in perfectly competitive markets will have index values equal to zero, indicating no pricing power—that is, no ability to set price above marginal cost.
On the other hand, an index number greater than zero indicates that a firm has pricing power, with a larger number indicating more power.
The Lerner Index and Bank Market Power
The Lerner Index is conceptually simple but can be hard to calculate, especially for banks. Most banks provide multiple services, including various types of loans, investment products and deposit accounts.
In principle, one could calculate a Lerner Index for each service. However, bank customers often receive several services from their bank, and it is difficult to identify the cost of providing specific services. Thus, researchers usually attempt to calculate a single, comprehensive index value for each bank.
And, even that calculation is not straight forward. A typical approach involves:
- Defining the bank’s output price as the ratio of its total revenues to total assets
- Estimating marginal cost econometrically from a model of bank production costs
However, this standard approach has some limitations. For example, most studies ignore banks’ off-balance-sheet activities, such as custodial and securities services, which are an important source of revenue and cost for some banks. Because large banks tend to generate more of their revenue from off-balance-sheet activities than small banks, failing to account for such activities in calculating the Lerner Index is especially problematic for the banks that are often of greatest concern to regulators and the public.
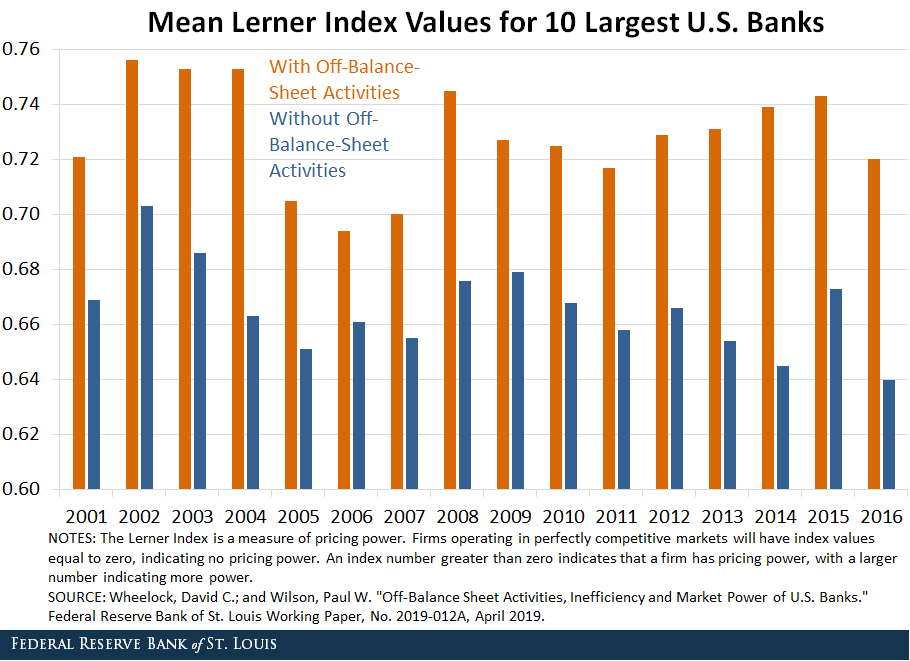
The figure below provides an indication of how much off-balance-sheet activities can affect estimates of the Lerner Index for large U.S. bank holding companies. It shows mean Lerner Index estimates for the 10 largest banks from 2001 to 2016, with one estimate based on a model that includes off-balance-sheet activities and another from an otherwise identical model that ignores such activities. For estimation details and other results, see Wheelock, David C.; and Wilson, Paul W. “Off-Balance Sheet Activities, Inefficiency and Market Power of U.S. Banks.” Federal Reserve Bank of St. Louis Working Paper, No. 2019-012A, April 2019.

On average, the estimates from the more comprehensive model are 9.5% higher than the other estimates. Roughly speaking, when we account for off-balance-sheet activities, we find that on average large banks have almost 10% more pricing power than if we ignore those activities.The differences are even larger for a few banks that specialize in off-balance-sheet activities. See Wheelock and Wilson, ibid., for individual bank estimates.
Measuring pricing power accurately is crucial for understanding competition in banking, and these results suggest that the level of competition might be less than previously thought.
Notes and References
1 See Elzinga, Kenneth G.; and Mills, David E. “The Lerner Index of Monopoly Power: Origins and Uses (PDF).” American Economic Review: Papers and Proceedings, May 2011, Vol. 101, No. 3, pp. 558-64.
2 For estimation details and other results, see Wheelock, David C.; and Wilson, Paul W. “Off-Balance Sheet Activities, Inefficiency and Market Power of U.S. Banks.” Federal Reserve Bank of St. Louis Working Paper, No. 2019-012A, April 2019.
3 The differences are even larger for a few banks that specialize in off-balance-sheet activities. See Wheelock and Wilson, ibid., for individual bank estimates.
Additional Resources
- Regional Economist: Why Are More Credit Unions Buying Community Banks?
- On the Economy: Banking on “Bank On”
- On the Economy: Can an Inverted Yield Curve Cause a Recession?
This blog offers commentary, analysis and data from our economists and experts. Views expressed are not necessarily those of the St. Louis Fed or Federal Reserve System.
Email Us
All other blog-related questions

