


Staff Pick: GDP, Labor Force Participation and Economic Growth

The On the Economy blog will periodically rerun blog posts that were of particular interest. The following is a post from August 2018 discussing GDP growth since the Great Recession.
During the Great Recession, which lasted from December 2007 until June 2009, economic activity in the U.S. contracted significantly. The policy response was unprecedented:
- The Federal Reserve relied on unconventional tools, like near-zero interest rates and large-scale asset purchases.
- The federal government incurred large and persistent deficits that implied a dramatic increase in the public debt.
- Fiscal and monetary policies have both been very active since the end of the recession, trying to get the economy back on track.
Yet, despite all these developments, the overall performance of the U.S. economy has been remarkably steady.
The figure below shows real gross domestic product (GDP) per capita from the first quarter of 1955 through the second quarter of 2018. In this post, real GDP per capita and real GDP per labor force participant are expressed in logarithms. At the time of this analysis, the latest data available were for the second quarter of 2018. The dashed line corresponds to the prerecession trend in GDP per capita.
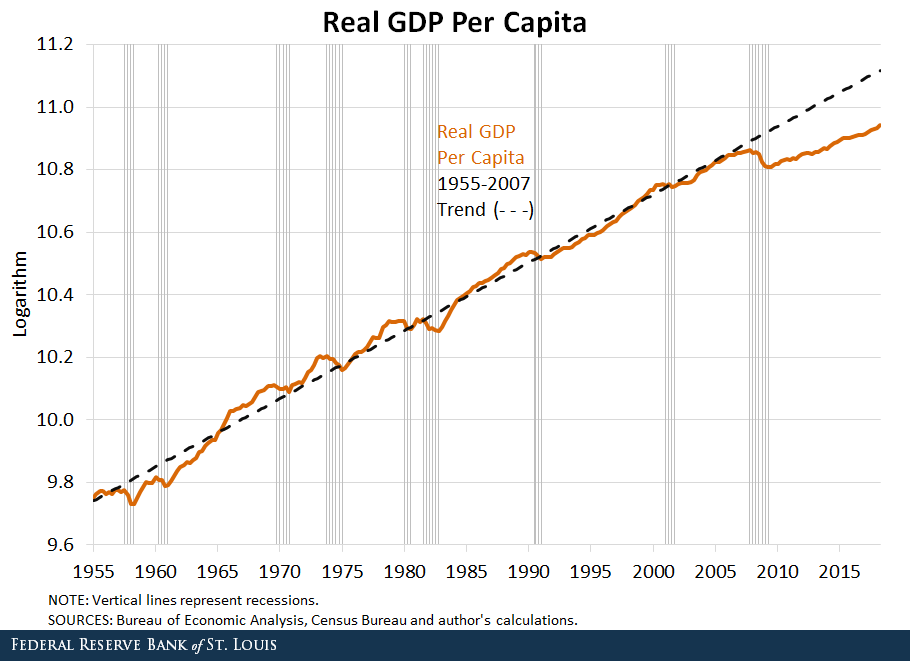
As we can see, GDP per capita contracted significantly during the Great Recession and has been persistently below trend since then. Notably, fluctuations in output have been mild since the recession ended, but growth rates have remained low.
In the pre-Great Recession period (1955 to 2007), GDP per capita grew at an average annual rate of 2.2 percent. In contrast, since 2010, output has been growing substantially slower at 1.6 percent annually. As of the second quarter of 2018, GDP per capita was roughly 16 percent below the prerecession trend.
The Role of Labor Force Participation
Some underlying long-term trends in the U.S. economy may blur our understanding of the current situation. Specifically, labor force participation has declined significantly since the early 2000s, mostly due to demographic trends, such as the baby boomer generation entering retirement.
One way to account for the effects of a changing labor force on output is to express real GDP in terms of the labor force, as shown in the figure below.
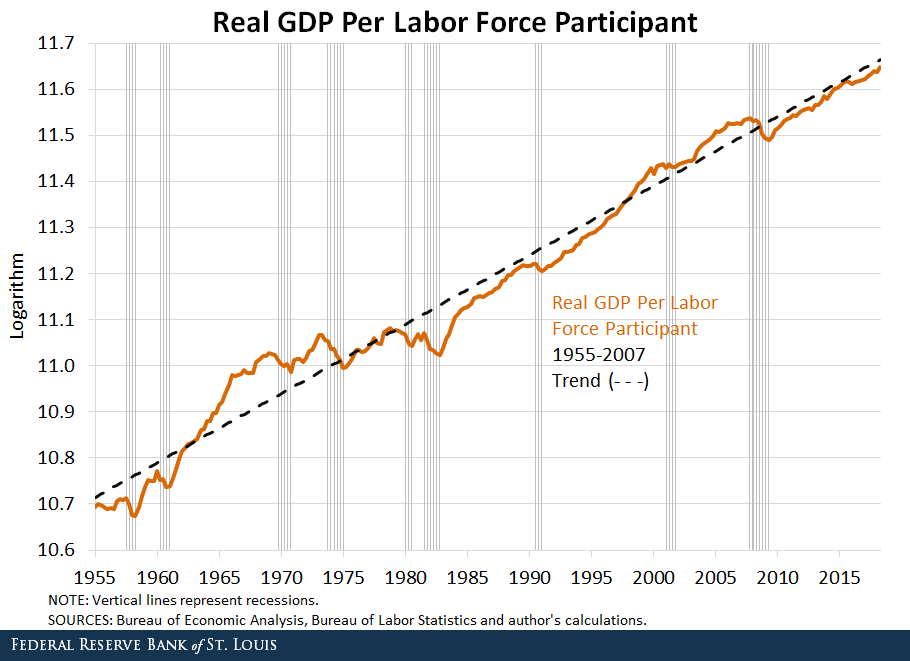
When divided by the labor force rather than population, real GDP still displays a severe contraction during the Great Recession but recovers differently. Though output was still slightly (less than 2 percent) below the prerecession trend as of the second quarter of 2018, the average growth rates for the two periods are the same: 1.7 percent annually. As in the previous figure, output appears less volatile in the period after the Great Recession.
Economic Growth since the Great Recession
When accounting for demographic realities (specifically, their impact on the labor force), the U.S. economy has displayed a satisfactory performance and a healthy outlook since the end of the Great Recession. Economic activity has been growing at a remarkably smooth pace, despite frequent and significant innovations in fiscal and monetary policies.
There are, however, challenges ahead. Notably, productivity appears to have been in a low-growth regime since the early 2000s. Whether government policy can help spur (or at least not impinge) the next big wave of technological advances is still an open question.
Notes and References
1 In this post, real GDP per capita and real GDP per labor force participant are expressed in logarithms. At the time of this analysis, the latest data available were for the second quarter of 2018.
Additional Resources
- On the Economy: How Capital Deepening Affects Labor Productivity
- The Regional Economist: Boomers Have Played a Role in Changes in Productivity
- From the President: Bullard on R-Star: The Natural Rate of Interest
Citation
ldquoStaff Pick: GDP, Labor Force Participation and Economic Growth,rdquo St. Louis Fed On the Economy, July 16, 2019.
This blog offers commentary, analysis and data from our economists and experts. Views expressed are not necessarily those of the St. Louis Fed or Federal Reserve System.
Email Us
All other blog-related questions