What Explains Rising Returns to High-Quality College Education?

The following post is the second in a two-part series on what’s behind the rising returns to high-quality college education.
The previous post in this series discussed how students at high-quality colleges have seen higher graduation rates and income relative to their peers at lower-quality colleges and how these gains have risen over time. This post looks at what’s possibly behind those rising returns.
In a recent Regional Economist article, Senior Economist Oksana Leukhina and Senior Research Associate Joseph McGillicuddy argued that increased sorting between students and colleges may help explain the rising gains.
“We argue that it is highly likely that a large part of the rising importance of college quality can be attributed to rising sorting on learning ability,” they wrote. “If the relative learning ability of students enrolled in top-quality colleges increased, this change would manifest itself in our analysis as increasing returns to college quality, in both graduation outcomes and earnings.”
They defined student learning ability as “a term that refers collectively to all student characteristics at the time of high school graduation that matter for both their academic success and labor market success (e.g., college preparedness, work ethic, grit, ambition).”
Factors that Could Drive the Rise in Student Sorting
The authors looked at three possible explanations for the increase in student sorting on ability. They said that all three factors have likely contributed to the widening learning ability gap between top- and bottom-quality institutions.
Rising College Premium
They noted that the younger cohort they studiedFor their analysis, the authors used data from the 1979 and the 1997 National Longitudinal Surveys of Youth. The 1979 survey follows a group of baby boomers (with many entering college around 1980), while the 1997 survey follows a group of millennials (with many entering college around 2000). In addition to questions on education and income, the authors noted that these surveys also included an aptitude test for all participants. They used the aptitude test score percentiles to approximate student learning ability, although they cautioned that aptitude test scores may be a fairly imprecise measure of learning ability. faced a significantly greater college graduation premium, which resulted in higher college enrollment (46% of high school graduates for the older cohort vs. 57% for the younger cohort). This included an influx of students with lower test scores from families of medium to higher incomes, the authors pointed out.
“As a result, the variation in learning ability among college entrants increased,” Leukhina and McGillicuddy wrote. “With less room to increase operating capacity, four-year schools increased their admission standards, and lower-ability students became more likely to enroll in community colleges with open-door admission policies.”
Tightening Financial Constraints
The authors noted that the average tuition paid by freshmen more than tripled for the younger cohort, and the direct cost of college (after accounting for the increase in the amount of grants and scholarships) more than doubled. Meanwhile, the increase in borrowing limits for subsidized Stafford loans barely changed from 1982 to 2000.
“As a result, the younger cohort had to rely more heavily on family transfers, work more hours while in college and enroll in less-expensive colleges,” the authors wrote. “Such downgrading of college choice would disproportionately affect the less-college-ready students as they tend to come from lower-income families.”
True Rising Return to a Higher-Quality College Degree
The authors noted it’s possible that the true return to a degree from higher-quality schools increased. This could result from increased expenditures on faculty, advising and career services.
“As a result, we would expect to see upgrading of college choice predominantly among the high-ability students—as these students can more easily keep up with stricter learning standards,” they wrote.
Evidence of Rising Student Sorting
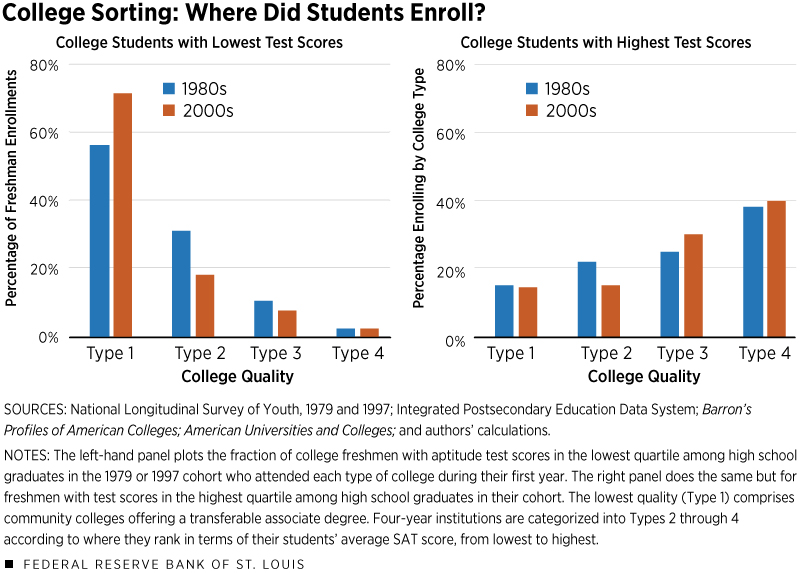
The figure below shows evidence of increased student sorting across colleges.

The authors noted that a majority of students who scored lowest on an aptitude test started at community colleges, as shown in the panel on the left. However, they pointed out that the share increased from just over half of the older cohort to nearly three-quarters of the younger cohort.
Among students who scored highest on the test (the panel on the right), the authors found that a larger share in the younger cohort enrolled as freshmen in the top two college types.
“While most of the action seems to concentrate in the rise of the community college track among lowest-scoring students, we also saw a substantial increase in sorting among four-year schools,” Leukhina and McGillicuddy wrote. In particular, they also found a relative decline of student ability in lower-quality colleges.
Notes and References
1 For their analysis, the authors used data from the 1979 and the 1997 National Longitudinal Surveys of Youth. The 1979 survey follows a group of baby boomers (with many entering college around 1980), while the 1997 survey follows a group of millennials (with many entering college around 2000). In addition to questions on education and income, the authors noted that these surveys also included an aptitude test for all participants. They used the aptitude test score percentiles to approximate student learning ability, although they cautioned that aptitude test scores may be a fairly imprecise measure of learning ability.
Additional Resources
- Regional Economist: What’s behind Rising Returns to High-Quality College Education?
- On the Economy: How Do Students Pay for College?
- On the Economy: Are Students Borrowing Too Much? Or Too Little?
Citation
ldquoWhat Explains Rising Returns to High-Quality College Education? ,rdquo St. Louis Fed On the Economy, Dec. 12, 2019.
This blog offers commentary, analysis and data from our economists and experts. Views expressed are not necessarily those of the St. Louis Fed or Federal Reserve System.
Email Us
All other blog-related questions

