


How Has Stock Ownership Trended in the Past Few Decades?
In February and March, stock markets whipsawed dramatically, bringing the S&P 500 Index down roughly 8 percent from its previous peak. Despite the media focus on the stock market correction and volatility, only about half of all American households currently have any stock holdings.
In this blog post, we look at stock market participation over the past 30 years, using data from the Federal Reserve Survey of Consumer Finances (SCF). A more detailed snapshot of stock market participation in 2016 using data from the most recent SCF is available in Ricketts, Lowell. “When the Stock Market Rises, Who Benefits?” St. Louis Fed On the Economy, Feb. 27, 2018.
Examining Middle-Aged Families
We restrict our analysis to “middle-aged families.” That is, we only look at households headed by somebody between the ages of 41 and 60. Younger families would have had significantly less time to accrue assets, and older families may have begun liquidating assets for retirement.
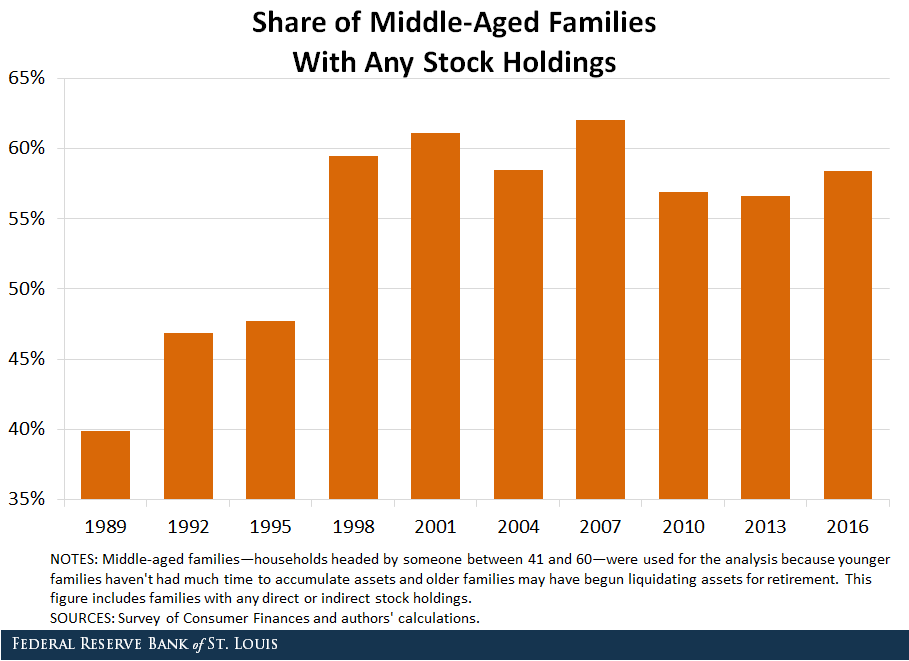
Participation Rates
While stock market participation is still far from 100 percent, the SCF provides some evidence that participation rates have improved over the last few decades. As seen in the figure below, the share of middle-aged households with direct or indirect stock holdings rose from 40 percent in 1989 to 61 percent in 2001. Indirect stock holdings are stocks held through mutual funds, trusts, tax-deferred retirement accounts and other managed investment accounts. Since then, the stock ownership rate has fluctuated between 57 percent and 62 percent.
Share of Wealth in Stocks
The importance of stock holdings as a source of household wealth has also increased significantly, as seen in the figure below.
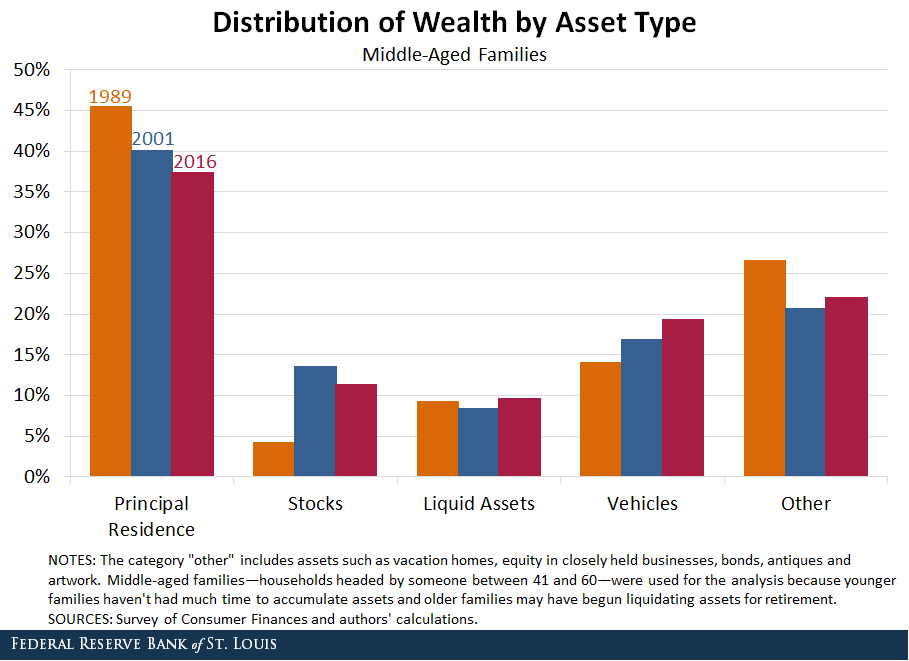
In 1989, stocks accounted for a small fraction of the wealth held by middle-aged families (4 percent), lagging far behind:
- Principal residences (46 percent)
- Vehicles (14 percent)
- Liquid assets such as checking and savings accounts (9 percent)
However, the share of household wealth in the form of stocks had nearly tripled by 2016, reaching 11 percent. Vehicles have also become more important, growing to 19 percent of household wealth. By comparison, the fraction owing to principal residences fell to 37 percent, while liquid asset holdings remained essentially unchanged.
Stock Holding Concentration
Even though these statistics provide some indication that stock market gains and losses are becoming increasingly shared throughout the population, the SCF also provides evidence that stock holdings have become more heavily concentrated among high net worth households.
In 1989, 74 percent of the stock market wealth held by middle-aged families belonged to the wealthiest 10 percent of those families. While this figure proceeded to decline steadily, falling to 69 percent in 2001, it has trended upward ever since, reaching a record-high of 78 percent in 2016.
Notes and References
1 A more detailed snapshot of stock market participation in 2016 using data from the most recent SCF is available in Ricketts, Lowell. “When the Stock Market Rises, Who Benefits?” St. Louis Fed On the Economy, Feb. 27, 2018.
2 Indirect stock holdings are stocks held through mutual funds, trusts, tax-deferred retirement accounts and other managed investment accounts.
Additional Resources
- On the Economy: When the Stock Market Rises, Who Benefits?
- On the Economy: How Worried Are Americans about Retirement?
- On the Economy: Why Are Banks Shuttering Branches?

Citation
B. Ravikumar and Evan Karson, ldquoHow Has Stock Ownership Trended in the Past Few Decades?,rdquo St. Louis Fed On the Economy, April 9, 2018.
This blog offers commentary, analysis and data from our economists and experts. Views expressed are not necessarily those of the St. Louis Fed or Federal Reserve System.
Email Us
All other blog-related questions