


Is Homeownership Bad for Wealth Accumulation?
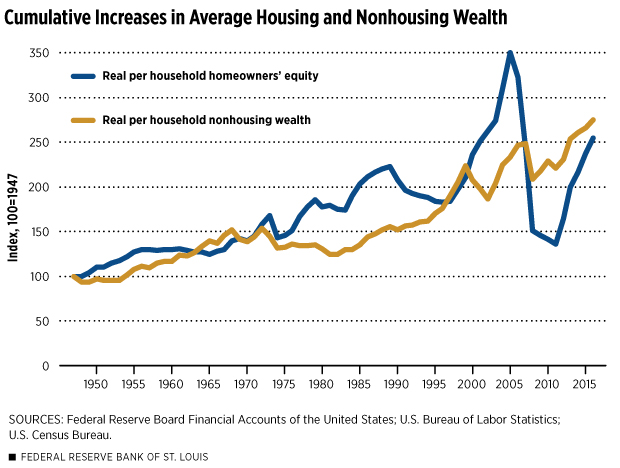
House prices have risen significantly from their low point after the Great Recession. Homeowners’ equity (HOE)—the market value of U.S. households’ residential real estate minus the value of home-secured debt—has increased even more in percentage terms; this is because leverage in the form of mortgage borrowing amplifies price gains, resulting in proportionately larger HOE wealth accumulation.
Leverage is a double-edged sword, however, as debt financing also magnifies house price declines, causing even steeper percentage losses in HOE. In fact, long-term data suggest that debt-financed homeownership, when compared with other sources of wealth such as stocks, bonds and savings accounts, may not generate returns high enough to compensate for the higher risk.1 Might concentrating a family’s wealth in homeownership that is financed with a large mortgage be hazardous to the family’s wealth? This seems especially likely for less wealthy families who may be vulnerable to income disruptions.
Why Recent Gains in House Values Are Misleading
Total HOE increased by $6.9 trillion between 2011 and 2016, according to the Federal Reserve’s Financial Accounts of the United States.2 After adjusting for inflation, this gain was $6.4 trillion, representing an average annualized increase of 13.5 percent.
Adjusted for changes in the number of households, inflation-adjusted HOE rose by 12.5 percent annually during 2011-16, compared with an average annualized increase of 4.4 percent for all other types of household wealth (Table 1, Column C). Both figures are far higher than their respective annual averages during the longest prior period available (1947-2011) of 0.5 percent for HOE and 1.2 percent for all other wealth.
Table 1
Aggregate Housing and Nonhousing Wealth, All Races
| A) Total amount (in $ trillions) | B) Average amount per household (in $ thousands) | C) Compounded average annualized change in B) after inflation* | D) Standard deviation of annual percent change | |||
|---|---|---|---|---|---|---|
| 2016 | 2016 | 1947-2011 | 2011-16 | 1947-2016 | 1947-2016 | |
| Homeowners’ equity (HOE) | $13.1 | $104.4 | 0.5% | 12.5% | 1.4% | 9.1% |
| All other household wealth | $79.0 | $628.1 | 1.2% | 4.4% | 1.5% | 4.9% |
| Total household wealth | $92.2** | $732.6** | 1.1% | 5.4% | 1.5% | 4.9% |
SOURCES: Federal Reserve Board Financial Accounts of the United States; U.S. Bureau of Labor Statistics.
*Continuously compounded average annualized changes for holding periods indicated, adjusted for inflation
**Totals are not exact due to rounding.
Nonetheless, three important pieces of long-run evidence suggest caution in advocating homeownership as a primary means of wealth accumulation for many families. First, HOE increased less than nonhousing wealth during the longest period of available data, 1947-2016, albeit by a small margin. Table 1 shows that nonhousing wealth increased by 1.5 percent annually, while HOE increased by 1.4 percent even with the strong increases in homeowners’ equity in recent years.
Second, the volatility of HOE during this long period far outstripped the volatility of nonhousing wealth (Table 1, Column D). This has been especially true in recent decades, as reflected in the figure below. While the estimates in Table 1 include the volatility of HOE in excess of house price variability induced by leverage, they do not reflect the extra volatility experienced by a family holding an undiversified housing portfolio—namely, a single house. Some research suggests that individual house prices may be twice as volatile as broad house price indexes; this lack of diversification, combined with leverage, can increase a family’s risk significantly:
“The high volatility of individual house prices, together with high transaction costs, lead to low Sharpe ratios (defined as average excess return on an asset, divided by its volatility) on housing.”3
Thus, when properly measured, investment in an individual house may be riskier than investments in nonhousing assets, as leverage amplifies the effects of house price fluctuations on HOE and virtually all families own just one house.
Finally, another Federal Reserve dataset, the Survey of Consumer Finances (SCF), reveals that housing wealth is especially volatile for black and Hispanic families (Table 2, Column C). Despite very high volatility, the average increases in the value of these families’ HOE are no higher than the gains experienced by white families. In contrast to the aggregate data described above, the SCF shows that nonhousing wealth generally increased much more than housing wealth with no higher volatility. (See comparative results in Table 2 and Table 3.)4
Table 2
Changes in Housing Wealth by Race or Ethnicity
| A) Compounded average annualized change in HOE after inflation* | B) Average three-year change in HOE after inflation** | C) Standard deviation of three-year change** | ||||
|---|---|---|---|---|---|---|
| 1989-2010 | 2010-16 | 1989-2016 | 1989-2016 | 1989-2016 | ||
| White non-Hispanic | 1.6% | 2.0% | 1.7% | 5.0% | 18.8% | |
| Black | 1.5% | -0.3% | 1.1% | 3.3% | 30.6% | |
| Hispanic | 0.6% | 5.4% | 1.7% | 5.0% | 41.5% | |
| Asian or other | 1.9% | 5.7% | 2.7% | 8.2% | 22.2% | |
SOURCE: Federal Reserve Board Survey of Consumer Finances (2016).
*Continuously compounded average annualized changes for holding periods indicated, adjusted for inflation
**Simple three-year average (standard deviation) calculated from all nine three-year periods between surveys
Table 3
Changes in Nonhousing Wealth by Race or Ethnicity
| Compounded average annualized change in non-HOE wealth after inflation* | Average three-year change in non-HOE wealth after inflation** | Standard deviation of three-year change** | ||||
|---|---|---|---|---|---|---|
| 1989-2010 | 2010-16 | 1989-2016 | 1989-2016 | 1989-2016 | ||
| White non-Hispanic | 2.6% | 5.0% | 3.1% | 9.3% | 15.3% | |
| Black | 1.7% | 8.5% | 3.2% | 9.7% | 28.2% | |
| Hispanic | 2.6% | 7.9% | 3.8% | 11.4% | 25.2% | |
| Asian or other | 3.4% | 2.9% | 3.3% | 9.9% | 19.7% | |
SOURCE: Federal Reserve Board Survey of Consumer Finances (2016).
*Continuously compounded average annualized changes for holding periods indicated, adjusted for inflation
**Simple three-year average (standard deviation) calculated from all nine three-year periods between surveys
Avoiding Homeownership for Building Wealth
To be sure, owner-occupied housing provides benefits to many families. It may be difficult to find rental housing of the quality, location, style, etc., comparable to owned housing. Owning provides a hedge against the risk of future rent increases; however, owning also means forgoing potential declines in rental housing costs. Owning also can make moving more expensive due to associated buying and selling costs.
There are portfolio diversification benefits to owning a house, as house price changes and returns on other assets are less than perfectly correlated. Overall, however, our data show that leveraged homeownership is riskier than nonhousing wealth and provides average increases that are no higher (and may be lower) than returns on nonhousing assets. This suggests that caution is warranted from a wealth-building perspective.
Black and Hispanic families have long maintained higher concentrations of housing in their portfolios than have white families, as shown in Table 4.5 This is an important reason why blacks’ long-run wealth trajectories have been lower and more volatile than those of whites. High concentration in housing also has made Hispanic families’ wealth much more volatile, although their average returns have been similar to whites’. Homeownership can be part of a financially sound household’s portfolio, but evidence suggests that it should constitute a limited share of total assets.
Table 4
Housing and Nonhousing Wealth by Race or Ethnicity in 2016
| A) Average amount of homeowners’ equity (HOE) | B) Average amount of non-HOE wealth | C) HOE share of total wealth | ||||
|---|---|---|---|---|---|---|
| White non-Hispanic | $205,145 | $695,467 | 22.8% | |||
| Black | $57,694 | $82,251 | 41.2% | |||
| Hispanic | $69,055 | $113,144 | 37.9% | |||
| Asian or other | $218,937 | $493,304 | 30.7% | |||
SOURCE: Federal Reserve Board Survey of Consumer Finances (2016).
Endnotes
- The figures discussed in this publication are not true rate-of-return calculations because balance-sheet aggregates reflect both changes in asset prices and net investment flows in all asset categories. However, these are appropriate measures of actual wealth accumulation by asset type. [ back to text ]
- See the Federal Reserve statistical release, dated Sept. 21, 2017, www.federalreserve.gov/releases/z1/Current/z1.pdf. [ back to text ]
- See Monika Piazzesi and Martin Schneider, “Housing and Macroeconomics,” National Bureau of Economic Research (NBER) working paper 22354, July 2016, p. 9, http://web.stanford.edu/~piazzesi/housingandmacroeconomics.pdf. [ back to text ]
- The two Fed datasets collect data in very different ways. The aggregate data in the Financial Accounts reflect institutional data sources, while the SCF data reflect individual survey responses. The SCF data include estimates made by families of the value of their nontraded assets, such as houses. [ back to text ]
- A previous issue of Housing Market Perspectives (Issue 5, July 2017) showed that black and Hispanic families historically have had higher shares of housing in their household portfolios when compared with white and Asian or other families. [ back to text ]
The St. Louis Fed's Housing Market Conditions Report
Housing Market Perspectives is published by the Community Development department at the Federal Reserve Bank of St. Louis in conjunction with its quarterly Housing Market Conditions report. The report provides an overview of housing market conditions for the U.S. and for the seven states that comprise the Federal Reserve’s Eighth District, as well as for the District’s four main metro areas: St. Louis; Little Rock, Ark.; Louisville, Ky.; and Memphis, Tenn.
Click on the location below to go directly to its latest maps and data.
This article originally appeared in our Housing Market Perspectives publication.

Citation
William R. Emmons, ldquoIs Homeownership Bad for Wealth Accumulation?,rdquo St. Louis Fed On the Economy, Nov. 24, 2017.
This blog offers commentary, analysis and data from our economists and experts. Views expressed are not necessarily those of the St. Louis Fed or Federal Reserve System.
Email Us
All other blog-related questions