Homeownership and the Racial Wealth Divide
A version of this article appeared earlier in Shelterforce, a blog of the National Housing Institute.1
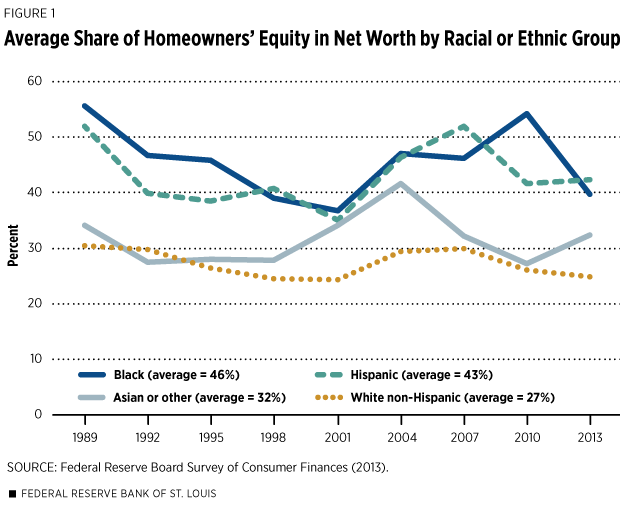
Homeowners‘ equity (HOE)—the market value of residential real estate minus the value of home-secured debt—has long been the single largest component of wealth for black and Latino families.2 On average during the past quarter-century, HOE accounted for nearly half of black and Latino families‘ wealth, compared with roughly a third for Asian or other families and about a quarter for white families (Figure 1).3 During peaks in 1989 and around the financial crisis starting in 2007, HOE accounted for more than half of the wealth of the average black and Latino family.
After 2007, large price declines and the loss of many homes through foreclosure or other distressed transactions served to reduce the 2013 share of wealth attributed to HOE to 40 percent for black families and to 42 percent for Latino families. This same share declined to 25 percent for white families and to 32 percent for Asian or other (henceforth, ”Asian“) families.
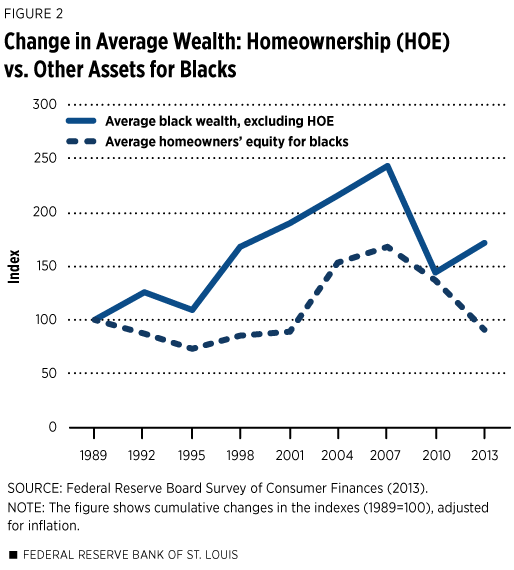
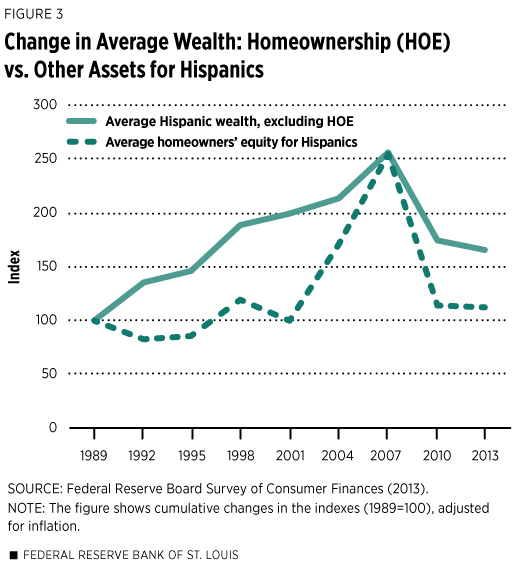
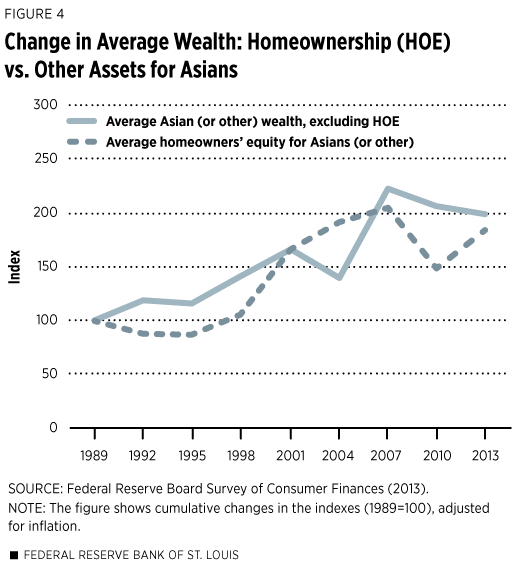
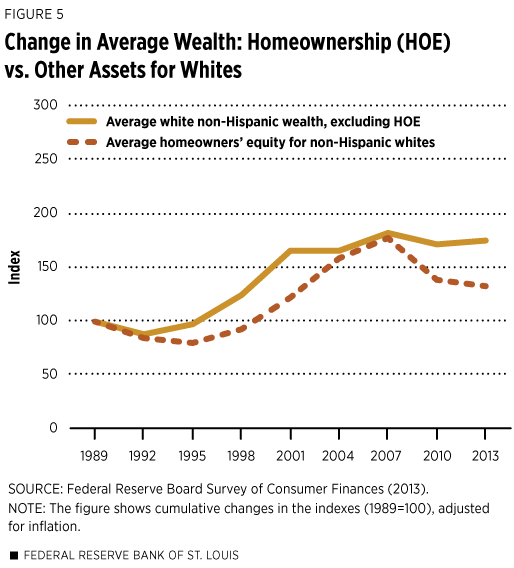
Despite its prominent role in black and Latino families‘ balance sheets, HOE contributed less than other assets to wealth accumulation during the 1989-2013 period covered by the Federal Reserve’s latest Survey of Consumer Finances (Figures 2 and 3). The same was true for the balance sheets of Asian and white families (Figures 4 and 5), which benefited from much larger investments in nonhousing assets.
The drag exerted by poorly performing housing assets on total wealth accumulation is starkly illuminated when comparing the major racial and ethnic groups. The table below shows the average annual increase in the inflation-adjusted value of homeowners‘ equity and all other asset types for each group during the 1989-2013 period.
Average Annual Percent Change in Inflation-adjusted Asset Values, 1989-2013
|
|
Homeowners’ equity (HOE) | All other assets less liabilities, excluding HOE | Total wealth (all assets less all liabilities) |
|---|---|---|---|
| Black | -0.4% | 2.3% | 1.0% |
| Hispanic | 0.5% | 2.1% | 1.3% |
| Asian or other | 2.5% | 2.9% | 2.8% |
| White non-Hispanic | 1.2% | 2.3% | 2.0% |
| All families | 1.0% | 2.1% | 1.8% |
SOURCE: Federal Reserve Board Survey of Consumer Finances (2013).
As the table shows, the inflation-adjusted value of HOE increased by only 0.5 percent per year for Hispanic families and actually declined, on average, by 0.4 percent per year for black families. White and Asian families, by contrast, saw significant increases.
Excluding HOE, rates of wealth accumulation were comparable among white, black and Hispanic families, while Asian families benefited from a significantly higher average gain. The final column indicates that the heavy concentration of black and Latino families‘ wealth in housing, and HOE‘s poor average returns, contributed to the significant lag in average overall wealth gains for these groups when compared with white and Asian families.
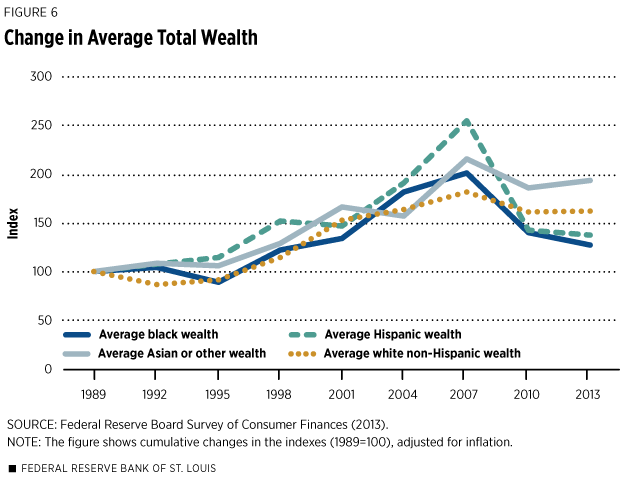
Figure 6 shows cumulative percentage increases in total average wealth during the 1989-2013 period. The figure makes clear that the relatively low cumulative increases in long-run wealth for black and Latino families resulted from large declines in asset values after 2007, when the financial crisis and then the Great Recession took their toll. In contrast, from 1989 to 2004, Latino and black families experienced greater average overall wealth gains than white and Asian families. The devastating collapse of housing markets after 2007 hit black and Latino families particularly hard because so much of their wealth was tied up in housing.
Drawing lessons from the past quarter-century, our research proposes three principles for sound financial management:
- Maintain adequate liquidity.
- Diversify assets broadly.
- Keep debt under control.4
Homeownership can make following these three tenets more difficult, especially for economically and financially vulnerable families. Indeed, our research suggests that families that concentrate their wealth in housing tend to accumulate less wealth on average over time.
Endnotes
- See http://shelterforce.org/2016/11/05/homeownership-is-a-culprit-in-the-racial-wealth-divide. [ back to text ]
- See Figures 6 and 7 in William R. Emmons and Bryan J. Noeth, “Economic Vulnerability and Financial Fragility,” Federal Reserve Bank of St. Louis Review, September/October 2013, Vol. 95, No. 5, pp. 361-88, https://files.stlouisfed.org/files/htdocs/publications/review/13/09/Emmons.pdf. [ back to text ]
- All data are from the Federal Reserve Board’s most recent (2013) Survey of Consumer Finances, a triennial, nationally representative sample of households. See https://www.federalreserve.gov/econresdata/scf/scfindex.htm. The racial and ethnic categories used throughout this article are as follows: 1) non-Hispanic white, 2) non-Hispanic African-American or black, 3) Hispanic of any race and 4) Asian or other, which includes people of Asian heritage as well as Native Americans, Pacific Islanders, Native Hawaiians and other groups not included elsewhere. [ back to text ]
- See William R. Emmons and Bryan J. Noeth, The Demographics of Wealth, Federal Reserve Bank of St. Louis, 2015, https://www.stlouisfed.org/household-financial-stability/the-demographics-of-wealth. [ back to text ]
This article originally appeared in our Housing Market Perspectives publication.
Citation
William R. Emmons, ldquoHomeownership and the Racial Wealth Divide,rdquo St. Louis Fed On the Economy, July 10, 2017.
This blog offers commentary, analysis and data from our economists and experts. Views expressed are not necessarily those of the St. Louis Fed or Federal Reserve System.
Email Us
All other blog-related questions


