


How Has the Current Account of the U.S. Changed?
The current account is the difference between total saving and total investment of an economy’s agents, that is, consumers, firms and the government.1 It reflects the amount of foreign debt that a country has with the rest of the world. If total saving is lower than investment, the country runs a current account deficit and is a net debtor to the rest of the world.
A current account deficit can be the result of a deficit of the private sector, a deficit of the government budget or a combination of both. So what does the current account of the U.S. look like?
The figure below shows the evolution of the current account, net private saving (saving net of investment) and net government budget in the U.S. as a percent of gross domestic product (GDP) from 2001-2014 and the International Monetary Fund’s projections for 2015-2020. During this period, the U.S. has been running a current account deficit. That is, it has been borrowing from the rest of the world.
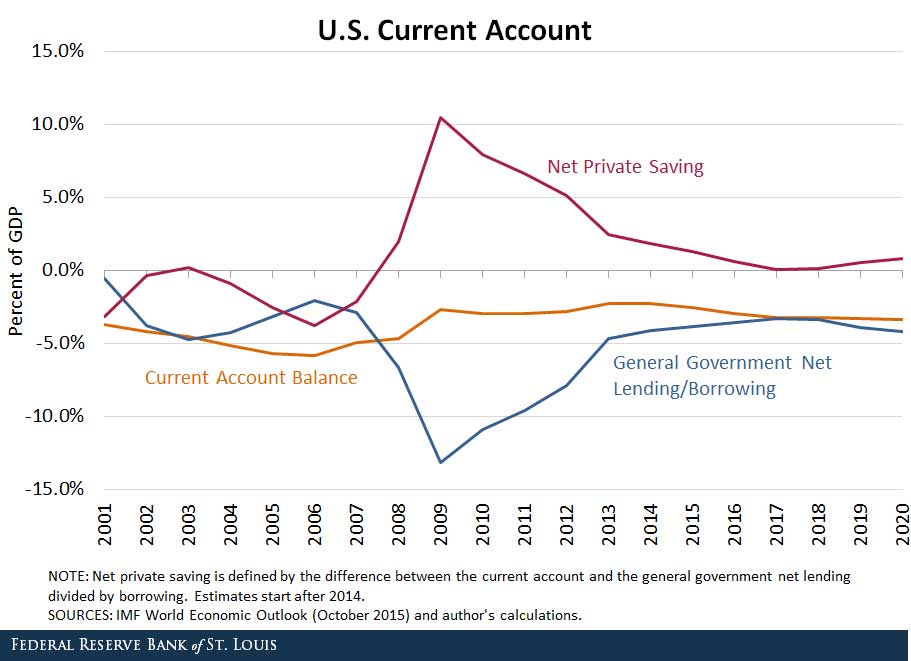
What explains this pattern? Prior to the financial crisis, the current account was about -6 percent of GDP. Both net private saving and the government budget were in deficit during this period. (For instance, net private saving was -3 percent of GDP in 2005, whereas the government was running a budget deficit of 3 percent of GDP. This accounts for a current account deficit of 6 percent of GDP.)
However, the picture changed right after the collapse of Lehman Brothers. The current account was still in deficit, but mainly because the government started running large budget deficits. There are two reasons for this:
- Revenues collected by the government went down, reflecting the decrease in income during this period.
- Government spending increased because of the stimulus package applied to alleviate the consequences of the financial crisis.
The private sector, however, started running large surpluses. During this period, there was a process of deleveraging of both consumers and firms. In 2009, for instance, the current account was about -3 percent of GDP. This was explained by a 13 percent deficit of the government and a 10 percent surplus of the private sector.
In economic crises, net private saving tends to move in the opposite direction of net saving of the government. There tends to be a deleveraging of the private sector, whereas the government tends to step in with stimulus measures to reactivate the economy.
Recently, the economy has been recovering, and both the surplus of the private sector and the deficit of the government have decreased. The private sector is gaining confidence and spending again, while the public sector has removed the fiscal stimulus that was needed to reactivate the economy during the crisis. Based on these trends, the IMF’s projection is for the current account to stay in deficit at close to 3 percent of GDP.
Notes and References
1 Saving is defined as the part of GDP (or income) that the agents of an economy (consumers, firms and the government) do not use for consumption.
Additional Resources
- On the Economy: Better Measure of Output: GDP or GDI?
- On the Economy: Global Current Account Surplus: Is There Trade with Other Planets?
- On the Economy: What Is Potential Output, and How Is It Measured?

Citation
Ana Maria Santacreu, ldquoHow Has the Current Account of the U.S. Changed?,rdquo St. Louis Fed On the Economy, March 29, 2016.
This blog offers commentary, analysis and data from our economists and experts. Views expressed are not necessarily those of the St. Louis Fed or Federal Reserve System.
Email Us
All other blog-related questions