How Volatile Are the Volatility Indexes?

The volatility of stock markets is a closely watched gauge of investor sentiment. This post documents that the volatility indexes of stock markets in the U.S. and Europe are themselves volatile and highly correlated.
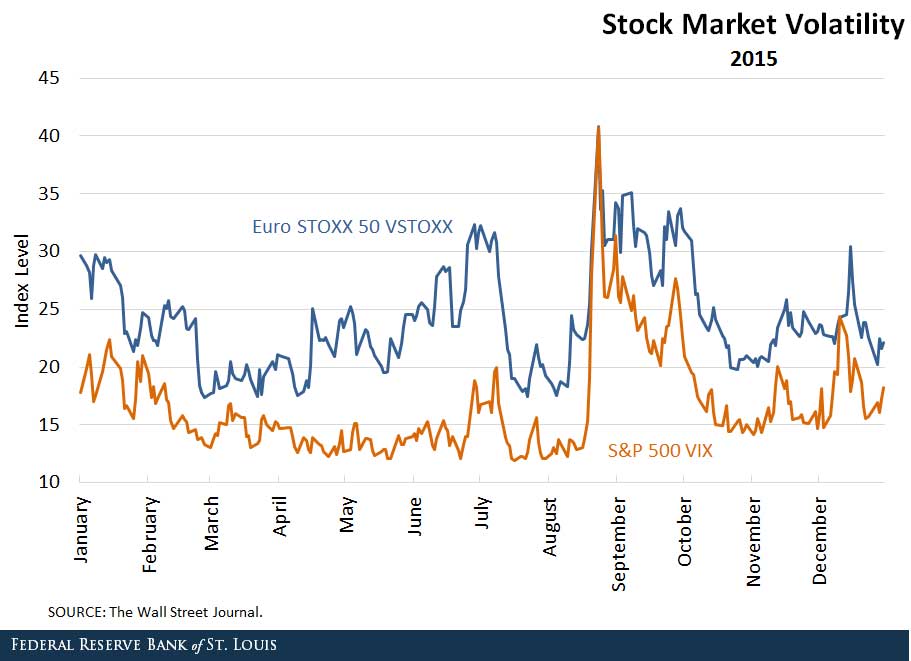
We used the VIX to represent the volatility index of the U.S. stock market and the VSTOXX for the European stock market. These indexes measure their respective market’s expectation of volatility in the near future. Our data cover all trading dates of 2015. The figure below shows the two indexes over the past year.

There are several important features worth documenting. Both indexes are highly volatile. For example, both indexes suddenly doubled in value within one week in mid-August. They also can drop dramatically within a short period of time, such as when the level of the VSTOXX declined from around 31 to around 17 in two weeks in July. The indexes are also highly correlated with each other. The correlation is around 0.8 in our sample period, which represents a highly positive correlation.
And the volatility indexes respond sensitively to events that cause uncertainty. The period between March and July marked an escalation of tension between Ukraine and Russia. During this period, the VSTOXX increased from less than 20 to more than 30, while the VIX remained relatively stable. The different paths of these indexes reflect that the geopolitical issues between Ukraine and Russia increased the uncertainty of the European stock market more than that of the U.S. market.
An episode of rising volatility that affected both markets occurred in the middle of August. Markets seemingly reacted to global growth concerns as well as the possibility of a rate hike at the Federal Open Market Committee meeting in September.
Why are these indexes so volatile and highly correlated? The first and most straightforward explanation is that market uncertainty is quite volatile and highly correlated across markets. In addition, changes in attitude toward risk can help explain this phenomenon, as observed by changes in risk premium. If investors suddenly become more risk averse, then the compensation of holding risky assets (measured by risk premium) should increase for investors to continue to hold risky assets. In this situation, the volatility may rise even if the actual uncertainty of the stock markets doesn’t change.
This is why volatility indexes—and the VIX in particular—are often denoted the “fear” index, reflecting the effect that risk attitude has on market volatility. Empirical studies have tried to distinguish and weight the relative importance of these two factors. The 2013 study by Geert Bekaert, Marie Hoerova and Marco Lo Duca found that adjusting monetary policy moves the volatility index, using as vehicles both the market uncertainty and risk aversion factors highlighted above.1 Their study also documents that the risk aversion factor plays a larger role relative to the uncertainty factor.
Notes and References
1 Bekaert, Geert; Hoerova, Marie; and Lo Duca, Marco. "Risk, Uncertainty and Monetary Policy." Journal of Monetary Economics, 2013, Vol. 60, Issue 7, pp. 771-88.
Additional Resources
- On the Economy: Overestimating the Loss of Human Capital
- On the Economy: What Causes a Country’s Standard of Living to Rise?
- On the Economy: How Credit Card Debt Default Has Evolved
Citation
YiLi Chien and Paul Morris, ldquoHow Volatile Are the Volatility Indexes?,rdquo St. Louis Fed On the Economy, Jan. 7, 2016.
This blog offers commentary, analysis and data from our economists and experts. Views expressed are not necessarily those of the St. Louis Fed or Federal Reserve System.
Email Us
All other blog-related questions


