


Where Are Immigrants to the U.S. Coming From?

This is the second post of a two-part series on immigration patterns.
Yesterday’s post examined the growth in immigration for the U.S. and the Eighth Federal Reserve District.1 Today’s post will examine where immigrants are coming from.
In an article in The Regional Economist, Research Officer and Economist Subhayu Bandyopadhyay and Research Analyst Rodrigo Guerrero noted that the draw of immigrants to a nation is affected by both push factors and pull factors:
- Pull factors are the desirable traits, such as higher income, of the host nation that draw in immigrants.
- Push factors are the undesirable traits, such as poverty, of the nation of origin that cause immigrants to move abroad.
Also, the cost of immigration may be a factor. The authors wrote: “For example, India is far from the U.S.; so, migration costs are relatively high. On the other hand, Latin America is relatively close to the U.S., reducing migration costs.”
Where Are They Coming From?
The table below shows the share of foreign-born population in 2014 for the U.S., for the four largest metropolitan statistical areas (MSAs) in the Eighth Federal Reserve District, and for the Chicago MSA for comparison’s sake. It also shows the compound annualized growth rate of foreign-born between 2005 and 2014 in parentheses.
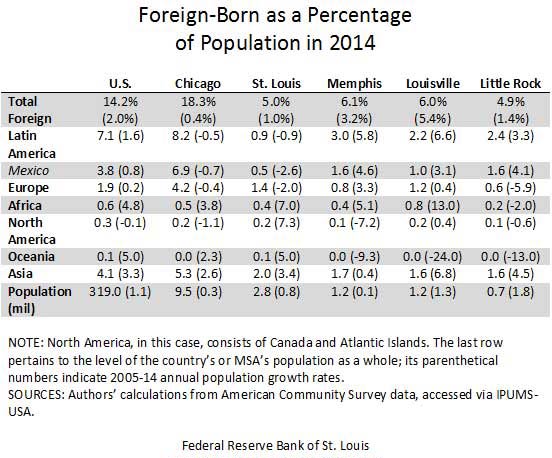
Bandyopadhyay and Guerrero noted that about half of the foreign-born in the U.S. in 2014 were from Latin America, and about half of those were from Mexico. Trends for the Chicago and most Eighth District MSAs were similar, but the St. Louis MSA had greater shares from both Asia (2.0 percent) and Europe (1.4 percent) than from Latin America (0.9 percent)
Overall growth for the foreign-born population was 2 percent per year for the period 2005-14, while growth for the population as a whole was around 1.1 percent. The authors noted: “What is quite interesting in looking at recent data on the foreign-born is that the Asian-born population, which was a substantial share of the total number of foreign-born in 2014, grew at a faster pace than the foreign-born population from Latin America.”
The authors concluded: “Future investigation may provide insights into the factors that are driving the difference in immigration patterns between the District and the nation, as well as among MSAs within the District.”
Notes and References
1 The Eighth District includes all of Arkansas and parts of Illinois, Indiana, Kentucky, Mississippi, Missouri and Tennessee.
Additional Resources
- Regional Economist: Immigration Patterns in the District Differ in Some Ways from the Nation’s
- On the Economy: How Has Immigration Grown in the U.S., Eighth District?
- On the Economy: State Policy Effects on Unauthorized Immigration
Citation
ldquoWhere Are Immigrants to the U.S. Coming From?,rdquo St. Louis Fed On the Economy, April 26, 2016.
This blog offers commentary, analysis and data from our economists and experts. Views expressed are not necessarily those of the St. Louis Fed or Federal Reserve System.
Email Us
All other blog-related questions