Immigration Patterns in the District Differ in Some Ways from the Nation's
Immigration has a variety of economic effects on a nation. For example, immigrants may provide employers with cheaper or more-skilled labor than what the native population provides, which makes the host nation more competitive in its export markets. Domestic consumers may benefit from lower prices due to greater production efficiencies. On the negative side, immigration may lead to overcrowding of cities and may cause public services to be stretched thin. On balance, if the positives outweigh the negatives, then immigration is viewed favorably by a host nation.
The stock of immigrants of a nation is affected by both push and pull factors. The pull factors are ones that raise the desirability of the host nation to a potential immigrant, factors such as higher incomes or presence of close family members in the host nation. The push factors are those in the source nation of the immigrant that encourage the potential immigrant to seek better prospects abroad—factors such as poverty. Another determinant of immigration patterns is the cost of immigration. For example, India is far from the U.S.; so, migration costs are relatively high. On the other hand, Latin America is relatively close to the U.S., reducing migration costs.
This overview first provides a sense of the extent of immigration into the U.S. and into the Federal Reserve’s Eighth District, served by the St. Louis Fed. Second, the source areas for immigrants coming to the U.S. and, more specifically, to the District, are identified. Regarding District immigrants, we restricted our attention to the four largest metropolitan statistical areas (MSAs), which are St. Louis, Memphis, Louisville and Little Rock. We compared these MSAs with the nation and also with the Chicago MSA, which is outside the District but is a good benchmark for comparison with District MSAs.
Measuring Immigration
After people immigrate, they may, over the years, become naturalized U.S. citizens. If we had excluded all such citizens from our immigration count, we might have ended up with a distorted sense of the role that immigration played in the recent past. An alternative was to count the number of foreign-born1 in the population, which reflects some of the recent past in addition to current immigration flows. This was the method we chose. We estimated the number of foreign-born using the birthplace variable of the American Community Survey (ACS) and the 1990 and 2000 censuses.
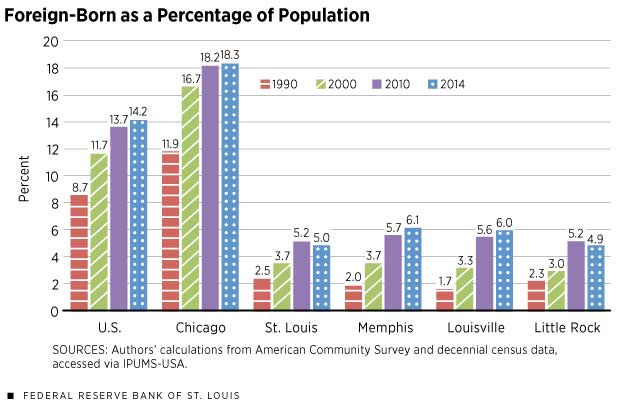
The chart shows that the share of the U.S. population that is foreign-born has risen steadily, from 8.7 percent in 1990 to 14.2 percent in 2014. Chicago has a similar trend but with higher initial and final shares of the foreign-born. The District MSAs have starkly lower figures, with Memphis having the largest share in 2014 at 6.1 percent. Considering, however, that the 1990 share in all four of the District MSAs was 2.5 percent or less, the trend in the District is one of growth. For example, St. Louis doubled its foreign-born share to 5 percent in the most recent estimate.
Where Are They Coming from?
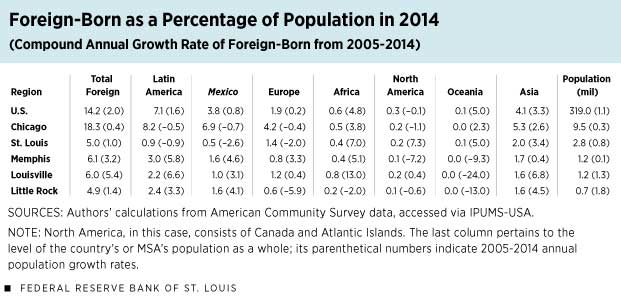
The table presents the share of foreign-born in the population in 2014 and the compound annualized growth rate of foreign-born between 2005 and 2014, shown in parentheses.2 The table also sorts these data by different geographical areas of origin. Out of all the foreign-born in the nation in 2014, about half were from Latin America, and about half of the Latin Americans were from Mexico. Asian nations contributed the next highest share, at 4.1 percent, followed by European nations at 1.9 percent, while the African-born share was a modest 0.6 percent. The picture was roughly similar for the Chicago MSA, except that the European share was considerably larger compared with that of the nation. In St. Louis, however, the Asian share (2 percent) was more than twice that of all of Latin America’s (0.9 percent), and the European share was 1.4 percent. The other district MSAs were more similar to the nation in the sense that the largest share of their foreign-born population was from Latin America.
For the U.S. as a whole, the foreign-born population grew at 2 percent per year in the 2005-2014 period. This substantially exceeded the overall annual U.S. population growth rate of 1.1 percent during the same period. What is quite interesting in looking at recent data on the foreign-born is that the Asian-born population, which was a substantial share of the total number of foreign-born in 2014, grew at a faster pace than the foreign-born population from Latin America. Chicago and St. Louis show a similar pattern, where the Latin American-born population actually shrank while that from Asia grew at a healthy clip. Little Rock saw the foreign-born from Asia grow at a somewhat faster rate than the Latin American-born, while in Louisville, the growth rates were similar. Memphis is the outlier in the District in the sense that it shows strong growth in Latin American-born but an almost level population of Asian-born over the 2005-2014 period.
Conclusion
The District’s foreign-born population share started from a much lower base in 1990 compared with that of the nation as a whole. Although the District’s foreign-born share has grown during this period (1990 to 2014)—with St. Louis and Little Rock doubling their foreign-born shares, and Memphis and Louisville tripling theirs—the District’s current share remains considerably lower compared to the national level. A closer look at immigration patterns in the last decade reveals a degree of heterogeneity in terms of the geographical areas of origin of the foreign-born within the District. Future investigation may provide insights into the factors that are driving the difference in immigration patterns between the District and the nation, as well as among MSAs within the District.
Endnotes
- The U.S. Census Bureau uses the term “foreign-born” to refer to anyone who is not a U.S. citizen at birth. This includes documented and undocumented immigrants. [back to text]
- For the computation of annual growth rates, we restricted the sample to the years in which American Community Survey data were available at the metropolitan statistical area level (2005-2014). [back to text]
Reference
IPUMS-USA, University of Minnesota. See www.ipums.org.
Views expressed in Regional Economist are not necessarily those of the St. Louis Fed or Federal Reserve System.
For the latest insights from our economists and other St. Louis Fed experts, visit On the Economy and subscribe.
Email Us


