


How Has Immigration Grown in the U.S., Eighth District?

This is the first of a two-part series on immigration patterns.
The percentage of foreign-born individuals in the U.S. is on the rise, according to a recent article in The Regional Economist.
Research Officer and Economist Subhayu Bandyopadhyay and Research Analyst Rodrigo Guerrero noted that immigration has a variety of economic impacts on a nation:
- On the positive side, for example, employers may gain cheaper or more-skilled labor than the native population provides.
- On the negative side, immigration may cause overcrowded cities and tax public services.
Their article sought to provide a sense of the extent of immigration into the U.S. and the Eighth Federal Reserve District.1 For their analysis, the authors opted against excluding people who became naturalized U.S. citizens. They wrote: “If we had excluded all such citizens from our immigration count, we might have ended up with a distorted sense of the role that immigration played in the recent past.”
Instead, Bandyopadhyay and Guerrero counted the number of foreign-born in the population. The table below shows the share of the U.S. population that is foreign-born. Their analysis covered not only the U.S., but also the four largest metropolitan statistical areas (MSAs) in the Eighth District, plus the Chicago MSA as a benchmark for comparison with District MSAs.
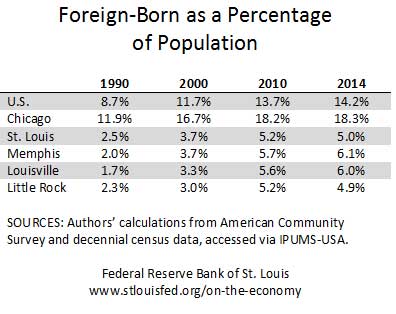
The U.S. saw an increase from 8.7 percent in 1990 to 14.2 percent in 2014. Though the Eighth District MSAs started with a much lower foreign-born population base than the nation as a whole, stark increases can be seen. St. Louis and Little Rock doubled their foreign-born shares from 1990 to 2014, while Memphis and Louisville tripled theirs.
The next post will examine the geographical areas of origin of the immigrants.
Notes and References
1 The Eighth District includes all of Arkansas and parts of Illinois, Indiana, Kentucky, Mississippi, Missouri and Tennessee.
Additional Resources
- Regional Economist: Immigration Patterns in the District Differ in Some Ways from the Nation’s
- On the Economy: State Policy Effects on Unauthorized Immigration
- On the Economy: Should We Be Concerned about the Economic Impact of Immigration on Native U.S. Labor?
Citation
ldquoHow Has Immigration Grown in the U.S., Eighth District?,rdquo St. Louis Fed On the Economy, April 25, 2016.
This blog offers commentary, analysis and data from our economists and experts. Views expressed are not necessarily those of the St. Louis Fed or Federal Reserve System.
Email Us
All other blog-related questions