


Where in the Map Is Low Inflation Coming from?

The annual inflation rate of the U.S. declined to about zero at the beginning of 2015, and it has remained at similar levels since then. Interestingly, this decline has led to large differences in inflation rates across U.S. regions.
We focused on inflation differences across the four Census regions: West, Midwest, Northeast and South. The figure below shows inflation rates for each of these regions, as well as national consumer price index (CPI) inflation.
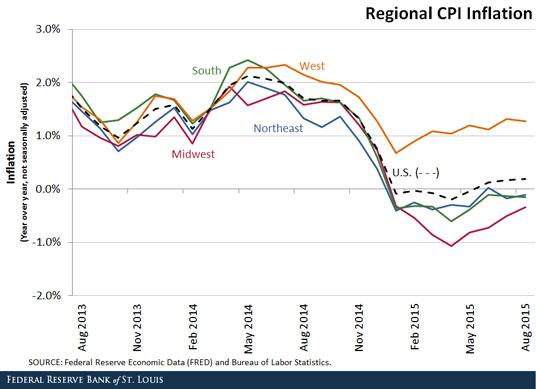
As the figure shows, all price growth in the U.S. in the past eight months came from the West. Since January, inflation in the West has been at least a full percentage point above that of the other three regions, which experienced deflation. Without the West region, the August national inflation rate would have been minus 0.19 percent instead of plus 0.20 percent.1
The next figure shows the contribution of different components of the CPI to the difference in annual inflation between the West and each of the other regions in August 2015.2
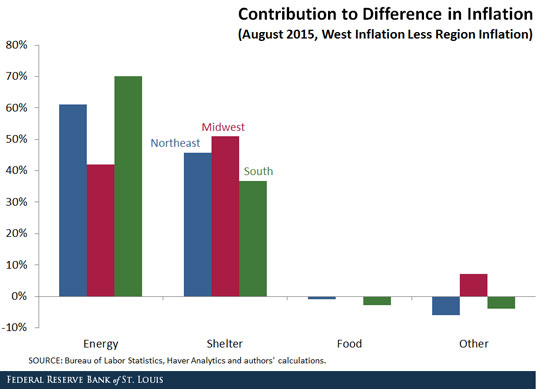
The figure suggests that the lion’s share of the current gap in inflation between the West and each of the other regions is explained by differences in energy inflation and shelter inflation. Differences in energy inflation explain between 42 percent and 70 percent of the gap, depending on the region. And differences in shelter inflation explain between 37 percent and 51 percent of the gap. On the other hand, differences in food inflation contributed between -3 percent and 0 percent, and all other components combined contributed between -6 percent and 7 percent.
We derive two conclusions from our calculations:
- First, the transmission of oil price shocks to energy prices differs across regions, causing the observed differences in energy inflation. However, this component of the regional differences in inflation should lessen as the temporary effects of the one-time drop in oil prices dissipate.
- Second, shelter inflation is a key driver of regional inflation differences. If shelter inflation in the West is driven by low interest rates, liftoff could push inflation in the West to the levels observed in the other regions. Some analysts have interpreted the rise of shelter inflation in the West as a potential “bubble.” Regardless of whether it is a bubble, an increase in interest rates could lead to lower shelter inflation.
Notes and References
1 The CPI “excluding the West” comes from a weighted average of regional CPI across the other three regions. The weights are set by finding a best fit of a weighted average (of the four regions) to the national CPI over the past five years. The R2 of the fitted CPI is 0.9999.
2 We followed the Bureau of Labor Statistics methodology to compute the contribution of each expenditure category to the inflation differentials. (See http://www.bls.gov/cpi/cpiriar.htm.) The weights for December 2013 are from http://www.bls.gov/cpi/usri09-102013.pdf.
Additional Resources
- On the Economy: Has the Phillips Curve Relationship Broken Down?
- On the Economy: Why Has Household Debt Declined?
- On the Economy: Should Core Inflation Be Measured Differently?

Citation
Alejandro Badel and Joseph McGillicuddy, ldquoWhere in the Map Is Low Inflation Coming from?,rdquo St. Louis Fed On the Economy, Oct. 5, 2015.
This blog offers commentary, analysis and data from our economists and experts. Views expressed are not necessarily those of the St. Louis Fed or Federal Reserve System.
Email Us
All other blog-related questions