


Are We Really Consuming More Services?

Strong consumer spending is often regarded as a good indicator of future economic growth. However, the components of total consumer spending are not necessarily good indicators of the real share of consumption because the components can have different inflation rates.
Consumer spending is usually broken down into three categories:
- Nondurable goods, such as food and clothing
- Durable goods, such as cars, furniture and home appliances
- Services, such as transportation, medical and education services
The first figure plots the U.S. consumer spending share in terms of these three categories since 1959.
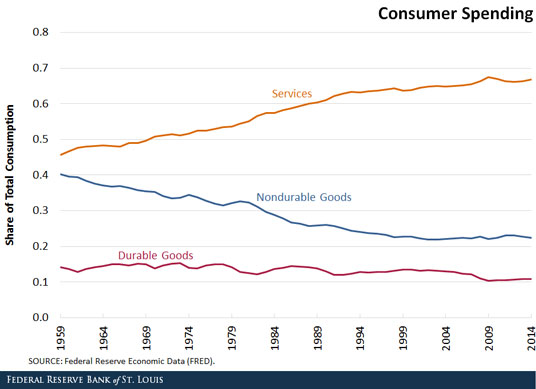
There is a clear increasing trend in the services category. The spending share of services increased from 46 percent in 1959 to 67 percent in 2014, while the share of nondurable goods dropped from 40 percent to 22 percent during the same period. In other words, U.S. consumers have spent relatively more on services than durable and nondurable goods over time.1
However, spending relatively more on services does not necessarily indicate that the real services consumption share is higher, as total consumer spending equals the price multiplied by the quantity. Consumers might spend more on services simply because of higher prices for services.
To shed light on this issue, we simply need to adjust the consumer spending in each category by its associated inflation index. This will measure real consumption for each category, which is displayed in the figure below.
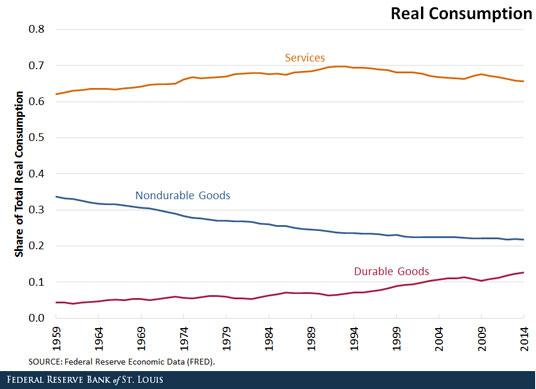
This paints a different picture than the first figure. The real consumption share of services has been relatively stable, ranging between 62 percent and 70 percent and currently standing at 66 percent. The composition of the real consumption share between durable and nondurable goods has changed over time. The real share of durable goods consumption nearly tripled (4.3 percent to 12.7 percent) in our sample period. The real share of nondurable goods consumption has declined steadily (33 percent to 22 percent). In terms of relative share of real consumption, U.S. consumers have consumed more durable goods and less nondurable goods over time.
Economists often care more about real consumption than nominal, especially in evaluating welfare. This article demonstrates that the nominal share of consumption has behaved very differently from the real consumption share because of inflation. The higher inflation rate on services and the lower inflation rate on durable consumption goods play a critical role in accounting for the differences.
Notes and References
1 Note that consumer spending on each category still increases over time because of positive economic growth.
Additional Resources
- On the Economy: Why Has Household Debt Declined?
- On the Economy: How Have Prime-Age Workers in School Affected the Labor Market?
- On the Economy: Has the Phillips Curve Relationship Broken Down?

Citation
YiLi Chien, ldquoAre We Really Consuming More Services?,rdquo St. Louis Fed On the Economy, Oct. 1, 2015.
This blog offers commentary, analysis and data from our economists and experts. Views expressed are not necessarily those of the St. Louis Fed or Federal Reserve System.
Email Us
All other blog-related questions