


Mortgage Debt and the Great Recession
Since World War II, U.S. households have been taking on larger levels of debt. The figure below shows the ratio of household debt to personal income from 1950 to 2014.1
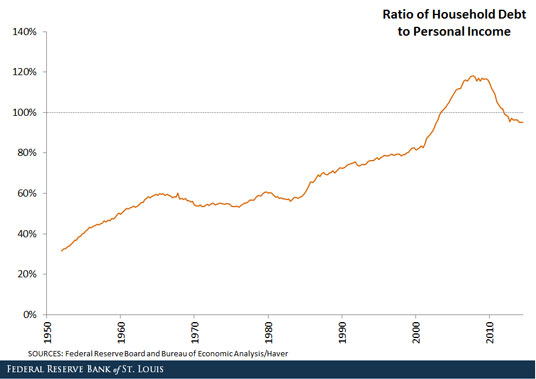
This ratio increased from around 31 percent in 1952 to 81 percent in 2000. In the early postwar years, the use of credit was not widespread, and the access to owner-occupied housing was also limited. During the housing boom of the early 2000s, private debt relative to personal income expanded significantly, with the ratio growing by 50 percent in seven years.
At the peak, household debt—which includes mortgages, automobile loans, unsecured debt (such as credit cards) and student loans—was 1.2 times larger than personal income. The Great Recession placed a severe stop on credit, and household indebtedness has been declining since 2008. The latest numbers indicate that this ratio is once again below 100 percent. The decrease in household debt has been often referred to as household deleveraging.
In a recent Dialogue with the Fed presentation, we explored which forms of debt contributed to the large increases in aggregate debt during the recent economic expansion (boom) and collapse (bust). We used the life cycle framework, which is important because the amount of debt incurred changes depending on ones’ life stage. For example, the use of mortgage debt is important for newly formed households, and student loans are a vital resource of college financing. Ignoring life-cycle aspects could give a bias on the access and use of credit.
To understand changes in household holdings of various forms of debt, we used a panel data set assembled by the Federal Reserve Bank of New York based on data by Equifax, a consumer credit reporting agency. The panel data represented a 5 percent random sample of credit reports spanning millions of individuals. The debt holdings we examined include unsecured debt,2 mortgage debt, auto debt and student loans for individuals. The most significant change in debt holdings occurred with respect to mortgage debt, shown below.3
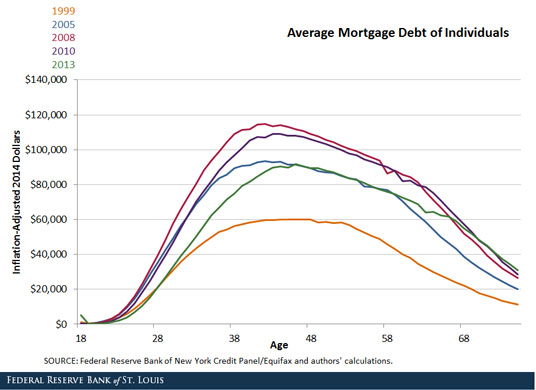
In 1999, mortgage debt had a hump-shaped pattern. More importantly, the peak occurred between age 35 and age 50, with average debts near $58,000 (in 2013 dollars). Given the increases in both house prices and ownership between 1999 and 2008 and the increased reliance on mortgage financing, mortgage debt holdings shifted upward in both 2005 and 2008 over all age ranges.
The most notable change was a peak that occurred at earlier ages. Peak mortgage debt increased from about $60,000 at age 45 in 1999 to about $114,000 at age 42 in 2008. After the onset of the Great Recession, there were some reductions in mortgage debt holdings for individuals under age 50 by 2010. However, large mortgage debt deleveraging occurred between 2010 and 2013 through gradual pay-downs, lower house prices, short sales and foreclosures, and fewer home buyers entering the market. This is evidenced by the fact that all age cohorts younger than age 60 decreased mortgage debt holdings relative to what previous life-cycle patterns would have predicted. However, mortgage debt did not revert back to 1999 levels.
Mortgage debt is typically the largest debt individuals hold and, thus, has been the most significant driver of the deleveraging process over the past few years. Tomorrow, we’ll look at how other forms of debt—unsecured debt, auto loans and student loans—have changed since 1999.
Notes and References
1 Personal income is “the income received by persons from participation in production, plus transfer receipts from government and business, plus government interest (which is treated like a transfer receipt).” Source: http://www.bea.gov/regional/pdf/spi2005/12%20Glossary.pdf
2 For our purposes, unsecured debt includes credit card debt, consumer finance loans and retail loans.
3 The figure reports unconditional average mortgage debt by age adjusted for inflation. By unconventional debt holding, we mean the average over all individuals whether or not they hold mortgages or other forms of debt.
Additional Resources
- Dialogue with the Fed: Household Debt in America: A Look across Generations over Time
- Center for Household Financial Stability: The Demographics of Wealth: Race, Ethnicity and Wealth
- On the Economy: Growth in Income Inequality Not the Same across the Nation


Citation
Carlos Garriga, Bryan J. Noeth and Don Schlagenhauf, ldquoMortgage Debt and the Great Recession,rdquo St. Louis Fed On the Economy, March 16, 2015.
This blog offers commentary, analysis and data from our economists and experts. Views expressed are not necessarily those of the St. Louis Fed or Federal Reserve System.
Email Us
All other blog-related questions