Oil Prices: Is Supply or Demand behind the Slump?
By Alejandro Badel, Economist, and Joseph McGillicuddy, Research Analyst
Oil prices have dropped more than 50 percent since mid-2014. Establishing whether demand or supply factors lie behind this slump is possibly useful for understanding its potential impact on the economy.
We set out to replicate a leading statistical decomposition of the factors affecting oil prices found in the economics literature. We followed the methodology in Lutz Kilian’s 2009 paper “Not All Oil Price Shocks Are Alike: Disentangling Demand and Supply Shocks in the Crude Oil Market,” a prominent empirical paper about oil prices and macroeconomic variables.1
The model used in the paper consists of a three-variable monthly frequency structural vector auto-regression. The three variables included are:
- Global crude oil production
- Global real economic activity measured using an index of freight rates
- Real crude oil prices
Then, three structural shocks are identified using the following assumptions (exclusion restrictions):
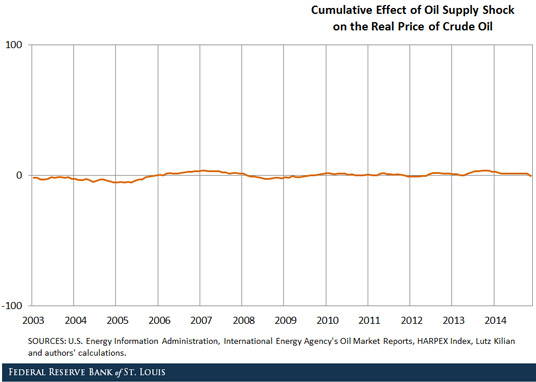
- “Supply shocks” are the unpredictable component of changes in crude oil production.
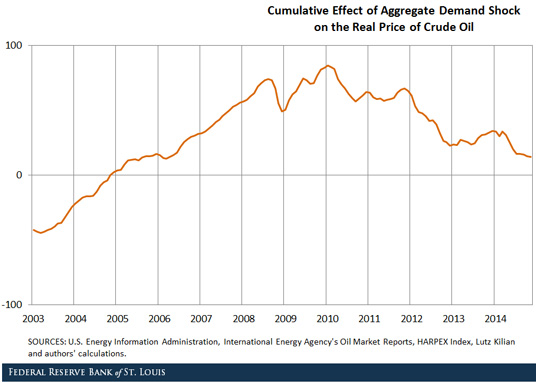
- “Demand shocks” are the component of innovations in real economic activity that cannot be explained based on crude oil supply shocks.
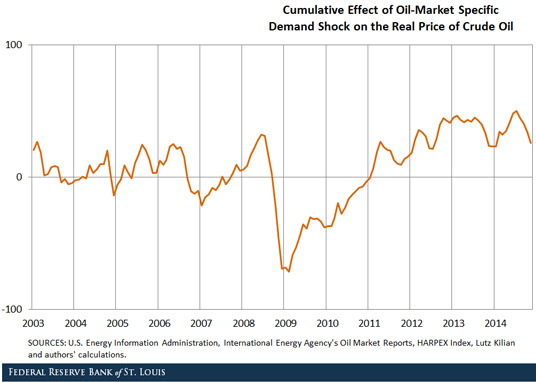
- “Oil-specific demand shocks” are innovations to the real price of oil that cannot be explained based on oil supply shocks or aggregate demand shocks.
The figures below show the results obtained from using code provided by the author after updating his dataset.


Note: World crude oil production for the period January 1973 through September 2014 is from the U.S. Energy Information Administration (EIA). We impute the October and November 2014 data points using total oil production data from the International Energy Agency’s Oil Market Reports. The updated index of real economic activity for the period January 1973 through October 2014 is from http://www-personal.umich.edu/~lkilian/reaupdate.txt. We impute the November 2014 point using the HARPEX index. It should be noted that changing the growth rate of the index by one standard deviation in either direction for November 2014 does not visibly affect the figure. The monthly nominal oil prices for the period January 1974 through November 2014 are from the EIA, while 1973 values are from the Kilian (2009) series.
The figures tell the following story:
- Between 2003 and 2008, aggregate demand shocks induced a run-up in oil prices.
- During the 2008 financial crisis, oil-specific demand shocks caused a sharp decline in the price of oil, while aggregate demand shocks ceased their upward pressure on oil prices.
- Following the financial crisis, positive oil-specific demand shocks and negative aggregate demand shocks resulted in roughly constant oil prices.
- During the second half of 2014, oil prices declined mostly because of negative oil-specific demand shocks, together with additional negative aggregate demand shocks.
Notes and References
1 Kilian, Lutz. "Not All Oil Price Shocks Are Alike: Disentangling Demand and Supply Shocks in the Crude Oil Market." American Economic Review, June 2009, 99(3), pp. 1053-69.
Additional Resources
- On the Economy: Why Don’t Gas Prices Always Move in Sync with Oil Prices?
- On the Economy: The Divergence of Spot Oil Prices
- On the Economy: Homeownership and House Prices No Longer in Sync
Citation
ldquoOil Prices: Is Supply or Demand behind the Slump?,rdquo St. Louis Fed On the Economy, Jan. 13, 2015.
This blog offers commentary, analysis and data from our economists and experts. Views expressed are not necessarily those of the St. Louis Fed or Federal Reserve System.
Email Us
All other blog-related questions

