


Economic Mobility across Federal Reserve Districts
By Alejandro Badel, Economist, and Joseph McGillicuddy, Research Analyst
Community development is not alien to the Federal Reserve System. Since 1981, each of the 12 Federal Reserve banks has had a community development office that provides financial institutions, nonprofit organizations and others with information on the Community Reinvestment Act, community and economic development, and issues related to credit access.1
In April, the Fed will host the ninth biennial Federal Reserve System Community Development Research Conference, which will focus on economic mobility. Speakers will include Federal Reserve Chair Janet Yellen, Reserve bank presidents James Bullard and Narayana Kocherlakota, and economist Raj Chetty, among others.
In this post, we propose using intergenerational income mobility as an indicator of community development.2 We employed a recent dataset by economists Chetty, Nathaniel Hendren, Patrick Kline and Emmanuel Saez (CHKS hereafter). The CHKS dataset contains the incomes of more than 40 million people and their parents between 1996 and 2012, as reported in their tax returns. Its main advantage for our current purpose is that mobility is measured at a fine level of geographical aggregation.
The measures of intergenerational economic mobility provided by CHKS are computed by concentrating on the group of people born in 1980-82. The family income of these persons in 2011-12 (when they were between 29 and 32 years old) was compared with the income of their parents in 1996-2000 (when they were between 14 and 20 years old). Among the measures provided by CHKS, we focused on the probability that a child raised in the bottom fifth of the U.S. income distribution rose to the top fifth.3 The figure below shows average economic mobility in each Fed district and the standard deviation (in percentage points) of the mobility indicator across counties within each district, weighted by population.4
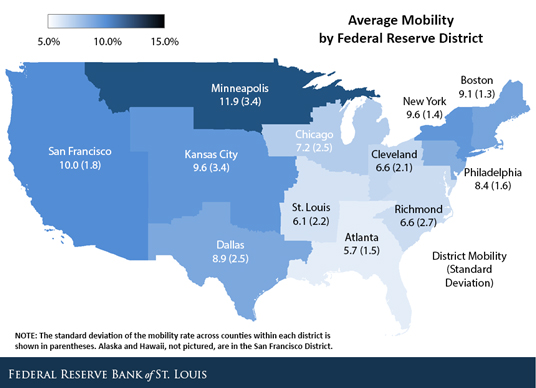
The figure shows large differences in mobility across the 12 districts. The Minneapolis District had the highest average mobility across districts. This is true even when excluding North Dakota and South Dakota, where some boom towns recorded extremely high mobility rates. (Doing so reduced mobility to 10.8 percent from 11.9 percent and the standard deviation to 3.2 percentage points from 4.8 percentage points.)
The San Francisco, New York, Boston and Dallas districts exhibited mobility rates above the national average of 8.2 percent, while also showing low dispersion of mobility rates across their counties. In contrast, within the group of districts with above-average mobility, the Kansas City District has the third-largest mobility rate but the second-highest dispersion after Minneapolis, while Philadelphia has the seventh-largest mobility rate but low dispersion.
The Chicago, Cleveland, Richmond, St. Louis and Atlanta districts displayed lower levels of mobility, substantially below the 8.2 percent national average. Furthermore, the Chicago, Cleveland, Richmond and St. Louis districts had the highest dispersion-to-mean ratios among all districts (excluding Minneapolis and Kansas City), which implies that they contained counties with extremely low mobility.
While there are other indicators of community development, we believe the geographical detail of the economic mobility indicators provided by CHKS could prove an interesting tool for the community development efforts of the Federal Reserve System.
Notes and References
1 For more information on what the Fed banks’ community development offices do, visit stlouisfed.org/community-development/about-us/community-reinvestment-act.
2 Chetty, Raj; Hendren, Nathaniel; Kline, Patrick; and Saez, Emmanuel. "Where Is the Land of Opportunity? The Geography of Intergenerational Mobility in the United States." National Bureau of Economic Research, January 2014, Working Paper 19843.
3 Individuals in the dataset were assigned to a commuting zone (as defined by the Census Bureau) based on where they were living in 1980-82, regardless of whether they moved afterward. Mobility indicators were calculated for all individuals within a commuting zone. For the particular indicator we looked at, CHKS considered the group of 14- to 20-year-olds whose family income was in the bottom 20 percent of the national income distribution in 1996-2000 and then found the fraction of this group that, as grown-ups (that is, by ages 29-32), had a family income in the top 20 percent of the national income distribution.
4 Our population weights were constructed using the 1982 county population under 5 years old.
Additional Resources
- On the Economy: How Difficult Is Moving Up in Income in the Eighth District?
- On the Economy: Will Household Deleveraging End Anytime Soon?
Citation
ldquoEconomic Mobility across Federal Reserve Districts,rdquo St. Louis Fed On the Economy, Feb. 16, 2015.
This blog offers commentary, analysis and data from our economists and experts. Views expressed are not necessarily those of the St. Louis Fed or Federal Reserve System.
Email Us
All other blog-related questions